Growth Analysis DataFinder
Growth Analysis DataFinder


- Documentation
 Growth Analysis DataFinderData Analysis and GovernanceAnalysis ToolUser AnalysisCohorts (User Grouping)
 Copy page
 Download PDFCopy pageDownload PDF
The practice of finding and saving users who have had the same attributes or behaviors over a period of time is to group users. User grouping is one of the important support means for fine operation. You can carry out user portrait, fine analysis, and accurate access to the subdivided user group. This article introduces you to the considerations and operational points for creating and using user clusters.
Typical use cases for user grouping include (but are not limited to):
- Screening specific populations for precise reach, such as defining lost populations and conducting reach recalls;
- Carry out sub-regional user operations, such as: carry out different operations for first-line, second-line and third-line users;
- Hierarchical division and analysis of users, such as: according to the frequency of use of core functions, users are divided into core users, active users, inactive users, lapsed users, etc., and analyzed separately;
- Targeted grouping of users according to behavioral characteristics, such as: UGC content platform divides users into content creators and content consumers.
User grouping supports three creation methods: rule creation, upload file creation, and SQL creation.
Click "Create Now" in the corresponding creation method card to create a cluster in the corresponding way on the pop-up page.
Creation method 1: Rule creation
That is to create user groups through event filtering, attribute filtering and other conditions, and support the selection of'daily routine 'or'manual update'.
Configuration basic information.
Parameter
Configuration instructions
Subgroup name
Custom cluster name.
Calculation period
Select what time period to calculate the user clustering results according to the user clustering rules configured below.
- Daily routine: After the user group is created, it will be calculated regularly every day. When selecting a daily routine, you also need to configure the calculation time below.
- The calculation time is the "default time": based on the fixed scheduling time of the system, the data of the previous day is routinely calculated every day.
- The calculation time is "specified time": You can customize the grouping calculation time according to the actual situation of business data.
warning
The actual cluster computation time is affected by factors such as the computing resources of the current DataFinder, so the actual computation time may be later than the "specified time" set here.
- Manual update: After the user group is created, it will be calculated, and it will not be automatically updated after the calculation is completed. If you need to recalculate, you need to manually click "Update".
Analysis subject
Only users with multi-principal enabled need to configure, where you can choose in which principal the user grouping is created.
tip
Multi-subject is an advanced function, which is only open to users who have actively applied for activation, and can only be used by users after SaaS-cloud native and privatized version 4.5. Please refer to the details Multi-Application/ Multi-Agent/ Multi-ID Type Overview.
Statistical caliber
SaaS-cloud native environment supports setting the statistical caliber of grouping. The default statistical caliber of DataFinder is "user (ssid) ". If you want to statistically analyze data of other calibers, you can first metadata management > statistical caliber Create other statistical calibers in the page and set them to be applied in "user grouping". After completion, you can switch here to select other analysis calibers.
Please see for details Use statistical criteria.tip
At present, SaaS-cloud-native environments support the use of multi-criteria clustering.
Grouping description
Custom grouping description.
- Daily routine: After the user group is created, it will be calculated regularly every day. When selecting a daily routine, you also need to configure the calculation time below.
Configure user cluster creation rules.
Parameter
Configuration instructions
Same time period/different time periods
- Same time period: All filters have the same time period.
- Different time periods: Customize the time period for each filter.
- Each time frame only supports selecting 365 consecutive days.
User grouping rule
You can flexibly use a combination of the following rules to filter users in the currently created cluster: "User has done", "User has not done", "User has not done globally", "Users have done in turn", and "User is".
- Each rule supports increasing the filter conditions of the corresponding rule, and the logical relationship between multiple filter conditions supports "AND/OR" switching. As shown in the figure below.
- When combining multiple rules, up to two layers of rules are supported, and the outer and inner rules support modifying the logical relationship between the rules, and support "AND/OR" switching.
For more details on the "user has done", "user has not done", "user has not done it globally", "user has done it in turn", and "user is" rules, please see the following Reference: User grouping creation logicchapters.
Estimated number of people
Click the refresh icon to immediately calculate the number of people in the current group.
Create method 2: Upload file creation
Create user groups by uploading id list files. When the project has multiple user IDs, you can choose one of them to upload. Please pay attention to keep the uploaded document ID type consistent with the page selection.
Create method 3: SQL creation
Configuration basic information.
Parameter
Configuration instructions
Subgroup name
Custom cluster name.
Calculation period
Select what time period to calculate the user clustering results according to the user clustering rules configured below.
- Daily routine: After the user group is created, it will be calculated regularly every day. When selecting a daily routine, you also need to configure the calculation time below.
- The calculation time is the "default time": based on the fixed scheduling time of the system, the data of the previous day is routinely calculated every day.
- The calculation time is "specified time": You can customize the grouping calculation time according to the actual situation of business data.
warning
The actual cluster computation time is affected by factors such as the computing resources of the current DataFinder, so the actual computation time may be later than the "specified time" set here.
- Manual update: After the user group is created, it will be calculated, and it will not be automatically updated after the calculation is completed. If you need to recalculate, you need to manually click "Update".
Analysis subject
Only users with multi-principal enabled need to configure, where you can choose in which principal the user cluster is created.
tip
Multi-main body is an advanced function, only open to users who have actively applied for activation, and only SaaS-cloud native , privatized 4.5 version after users can use , please see for details Multi-Application/ Multi-Agent/ Multi-ID Type Overview.
Grouping description
Custom grouping description.
- Daily routine: After the user group is created, it will be calculated regularly every day. When selecting a daily routine, you also need to configure the calculation time below.
Configure the creation rules for user clusters through custom SQL.
Parameter
Configuration instructions
Select a time zone
Select the corresponding time zone according to your actual time zone at the top of the configuration box to ensure that the data will not have errors due to time zone problems, and the default is the time zone configured in the first application.
Configuring SQL Rules
Customize the SQL code that creates the cluster in the SQL code box.
- The current SQL rules are defined in a similar way to SQL custom queries. You can query the events table, users table, Items table, cohorts table, and use supported functions. Please refer to the details of the currently supported tables, table fields, functions, etc Custom SQL Query.
warning
- When configuring SQL rules, you must return the " stat_standard_id " and " hash_uid " fields (user ID fields) to filter users when creating clusters.
- DataFinder will deduplicate the user IDs of the two fields based on the query results of these two fields, and the deduplicated users are the people in the cluster.
- Querying data up to 730 days is currently supported; you can also click " + event time " at the bottom of the code box to define dynamic time parameters for use in SQL rule code.
- You can click "Format" and "Reset" at the top right to quickly adjust the SQL command format and clear the SQL command.
Configuration example:
- SaaS-cloud native environment:
select
  hash_uid,
  stat_standard_id
from
  events
where
  event_date >= '2025-07-11'
  and event_date <= '2025-07-13'
  and ((event = 'predefine_pageview'))
group by
  hash_uid,
  stat_standard_id
Estimated number of people
Click the "Estimated Number of People" refresh small icon above to immediately calculate the number of people in groups under the current rules.
- The current SQL rules are defined in a similar way to SQL custom queries. You can query the events table, users table, Items table, cohorts table, and use supported functions. Please refer to the details of the currently supported tables, table fields, functions, etc Custom SQL Query.
Once the configuration is complete, click Save to save the cluster to the cluster list.
When saving a cluster, DataFinder will verify your SQL rules. If there are any errors, please follow the interface prompts to modify the SQL rules.
- Analyze sub-group users. In the user cluster list, find the newly created user cluster, and then:
- Click "user portrait" to analyze the user profile of the subgroup;
- Click "View User List" to view the users of the group, and you can check the corresponding attributes to download at the same time;
- Use user grouping in other Finder analysis functions. Take the "Event Analysis" function as an example:
- Enter "Event Analysis" and select the event to analyze.
- Select the user group in the user filter as the filter criterion.
Here, the following management operations can be performed on user groups:
- If there are many user groups, you can use the "I created" or search function to find user groups.
- Analyze the user groups in the list, as well as download, edit, refresh, copy, delete, and other operations.
- View User List.
After entering the user list, it is pointed out that user attributes are ticked, and downloads are supported at the same time, as shown below:
Historical backtracking (rule creation only)
This feature allows you to retrace the cluster results 7 days after the creation date, in order to quickly understand the historical trends of the cluster.
- The clusters created after 2022-05-16, the cluster details page - list area shows the latest calculation results by default, and supports you to re-run the data 7 days after the creation date to help you quickly understand the trend of cluster results under this condition.
- Clusters created before 2022-05-16 do not support history backtracking by default.
- If you need to backtrack the data "7 days after the creation date", please do not modify the clustering conditions and click "Recalculate".
- If you modify the clustering conditions, you can also perform batch recalculation of the clustering of existing historical results (calculated according to the latest conditions).
- If you need to backtrack the data "7 days after the creation date", please do not modify the clustering conditions and click "Recalculate".
Historical results
The grouping task of rule creation & file upload can view the calculated historical results of the grouping.
- The clustered task created by the rule.
Whether it is a manual update or a daily routine grouping task, you can see in the details page the actual historical results of the calculation within the selected date range .- Historical results: Take the manually updated grouping task as an example, if the grouping creation date is 2022-5-10, and update the excessive group calculation result in the 2022-5-12, in the grouping details, only the calculation data of 5-10 & 5-12 is recorded.
- Multiple calculations on the same day: If you perform multiple calculations on the cluster on the natural day, only the last calculation result will be retained (for example, on the day of 5-12, 3 recalculations have been generated, and the system only retains the last calculation result on the day).
- View the user list : Click to jump to the user review to view the subgroup user list.
- Recalculate : After clicking, recalculate according to the latest calculation conditions of the subgroup.
- Download : Then download according to the latest results.
- Grouping tasks for file uploads
On the details page, you can see the actual historical results of the calculation within the selected date range; and support'view user list 'and'download' grouping.
Cluster creation rule description
Rule condition | Explain | ||
|---|---|---|---|
User did | In the total number of users (the default is active users in the past year), filter out the users who have done something a specified number of times within a specified time frame. warning When circling with "user done", in the filter rule, you need to ensure that the number of times the user has done an event is > 1, and the result of circling is empty when the number of times = 0 or the number of times < 1. Calculation conditions :
Value range :
| ||
The user has not done it. | In the total number of users (default is active users in the past year), remove (not in) users who have done something within the specified time frame. | ||
The user has not done it globally. | In all objects (including users who have not had any events), remove (not in) users who have done something within the specified time frame. | ||
Users did it in turn | Specifies a sequence of event behaviors that will be selected only if the user fires these events in sequence. | ||
User is | Support for selecting user attributes, user groups, and user labels (the latest value is selected by default). | ||
Time of grouping computation
- At present, the system will start routine calculation and grouping at 6 o'clock every day, and usually complete a calculation before 8 o'clock.
- If'today 'is included in the grouping time condition, real-time calculation will be triggered when the first calculation & refresh is performed; the daily routine task only calculates the data of t-1 days.
Current clustering computing strategies ensure that users are as up-to-date as possible when using clustering.
Calculation time of static grouping
- If your clustering condition contains only static time (such as 2022.1.1 - 2022.2.1), the calculation only supports manual updates.
- If you don't need to update the cluster results daily, you can also choose to update them manually.
Cluster calculation logic change description
Cluster calculation logic changes, please pay attention to:
- Calculation logic change description
- When the condition is "the user is the province is not equal to Jiangsu" (the province is the attribute that calculates all values), only the users whose provinces are not equal to Jiangsu in the time range are calculated. (Previously, the rules would also include users who have reported data in the past 1 year but have not reported data in the query range)
- When the condition is "User has done event A less than 3 times", the query result is that users who have done event A equal to 2 or 1 times among active users, and users who have done event A 0 times are not counted. (The old version will count non-DAUs. If you need to cover this part of the user, you can add "User has not done event A")
- Adjustment impact
- Clusters created/updated before February 9, 23 are still calculated according to the old rules. If the historical version of the cluster needs to be calculated according to the new rules, you can click "Recalculate"; the updated version from February 9 is calculated according to the new rules.
- Clusters created/updated after 9/2/23 are all calculated according to the new rules.
[Low Active Users] Circle selection example
In the daily operation process of content products, manual re-engagement is required through some operations, so operation students often need to find "low-active" users for operation actions. Re-engagement is generally aimed at two types of users, one is users with low activity frequency in the past 7/14 days, which can directly send push messages to recent popular content to promote such customers to open recommended content; the other is nearly 7/14 days Not active, but the previous period was active lapsed users can send text messages with stronger incentives such as friend comments or like records to attract users to return.
The low-frequency user circling logic is relatively simple, and it is only necessary to select the number of times the user triggers the target event within a specified time to be less than or equal to a certain value:
Lapsed users involve different time periods and need to be logically combined with undone logic:
[Recall dormant users] I have used it in the last 30 days but not in the last 7 days
[Users have done it in a row] I have done it in the last 30 days. Open the app first and then search...
Q1 Why do some analysis charts prompt me "The selected" user segmentation "does not support today's real-time data analytics"?
When the condition includes user grouping, we temporarily do not support the calculation of the data of the day together.
Q2 Why is the result of choosing a platform that is iOS or a user with more than 5 visits to Android greater than the sum of the number of queries that the platform is iOS and Android respectively?
Because some users are using both iOS and Android. The two devices were used less than five times each, but adding them together was just over five times. Then the user will be included in the cluster.
Q3 Open the file that exports the user ID. Why is the user ID represented by scientific notation, and how can it be displayed correctly?
The file for exporting the user ID is in CSV format. It may be opened with Excel or WPS by default on your computer. After opening it, you will see that the value of the user ID is displayed in scientific notation, and the original value cannot be restored. As shown in the following figure:
The reason for this problem is that when Excel and WPS open CSV, they automatically convert long numbers into scientific notation and save them as strings. This conversion is irreversible, so the original value of the number cannot be restored.
Solution
Option 1: Import CSV directly into Excel
Through the import function of Excel, the data format of the column containing the super-long value is changed to "text" in the import process, which can be displayed correctly. If your Mac Excel version is 16.59, you may not be able to correctly recognize the content of the CSV due to known issues with Excel.
Mac Excel example
- Create a blank Excel document.
- Click
File > Importand select the csv file you just downloaded; - In the second step, select "comma" as the separator.
- In the third step, select "Text" in the
column data format, and select "User ID" column in thepreview selected data(black when selected); - Click
Finishand complete the next steps by default;
As shown in the figure below, the A column imported according to the above steps can be directly displayed as the correct content.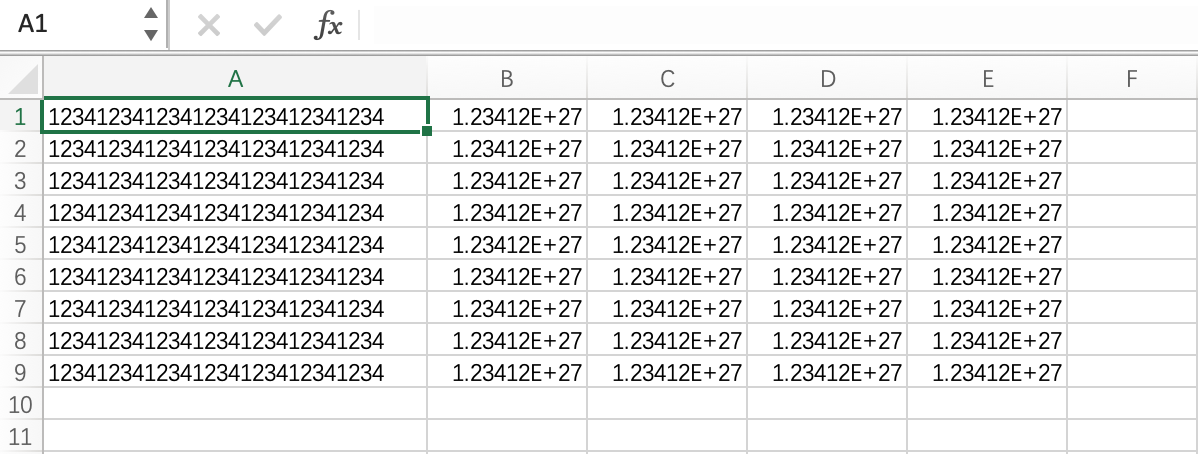
Option 2: Import through the Excel "Get Data" function
Mac Excel example
- Create a blank Excel document.
- Click "Data" > "Get Data" and select the data source of "Text/csv".
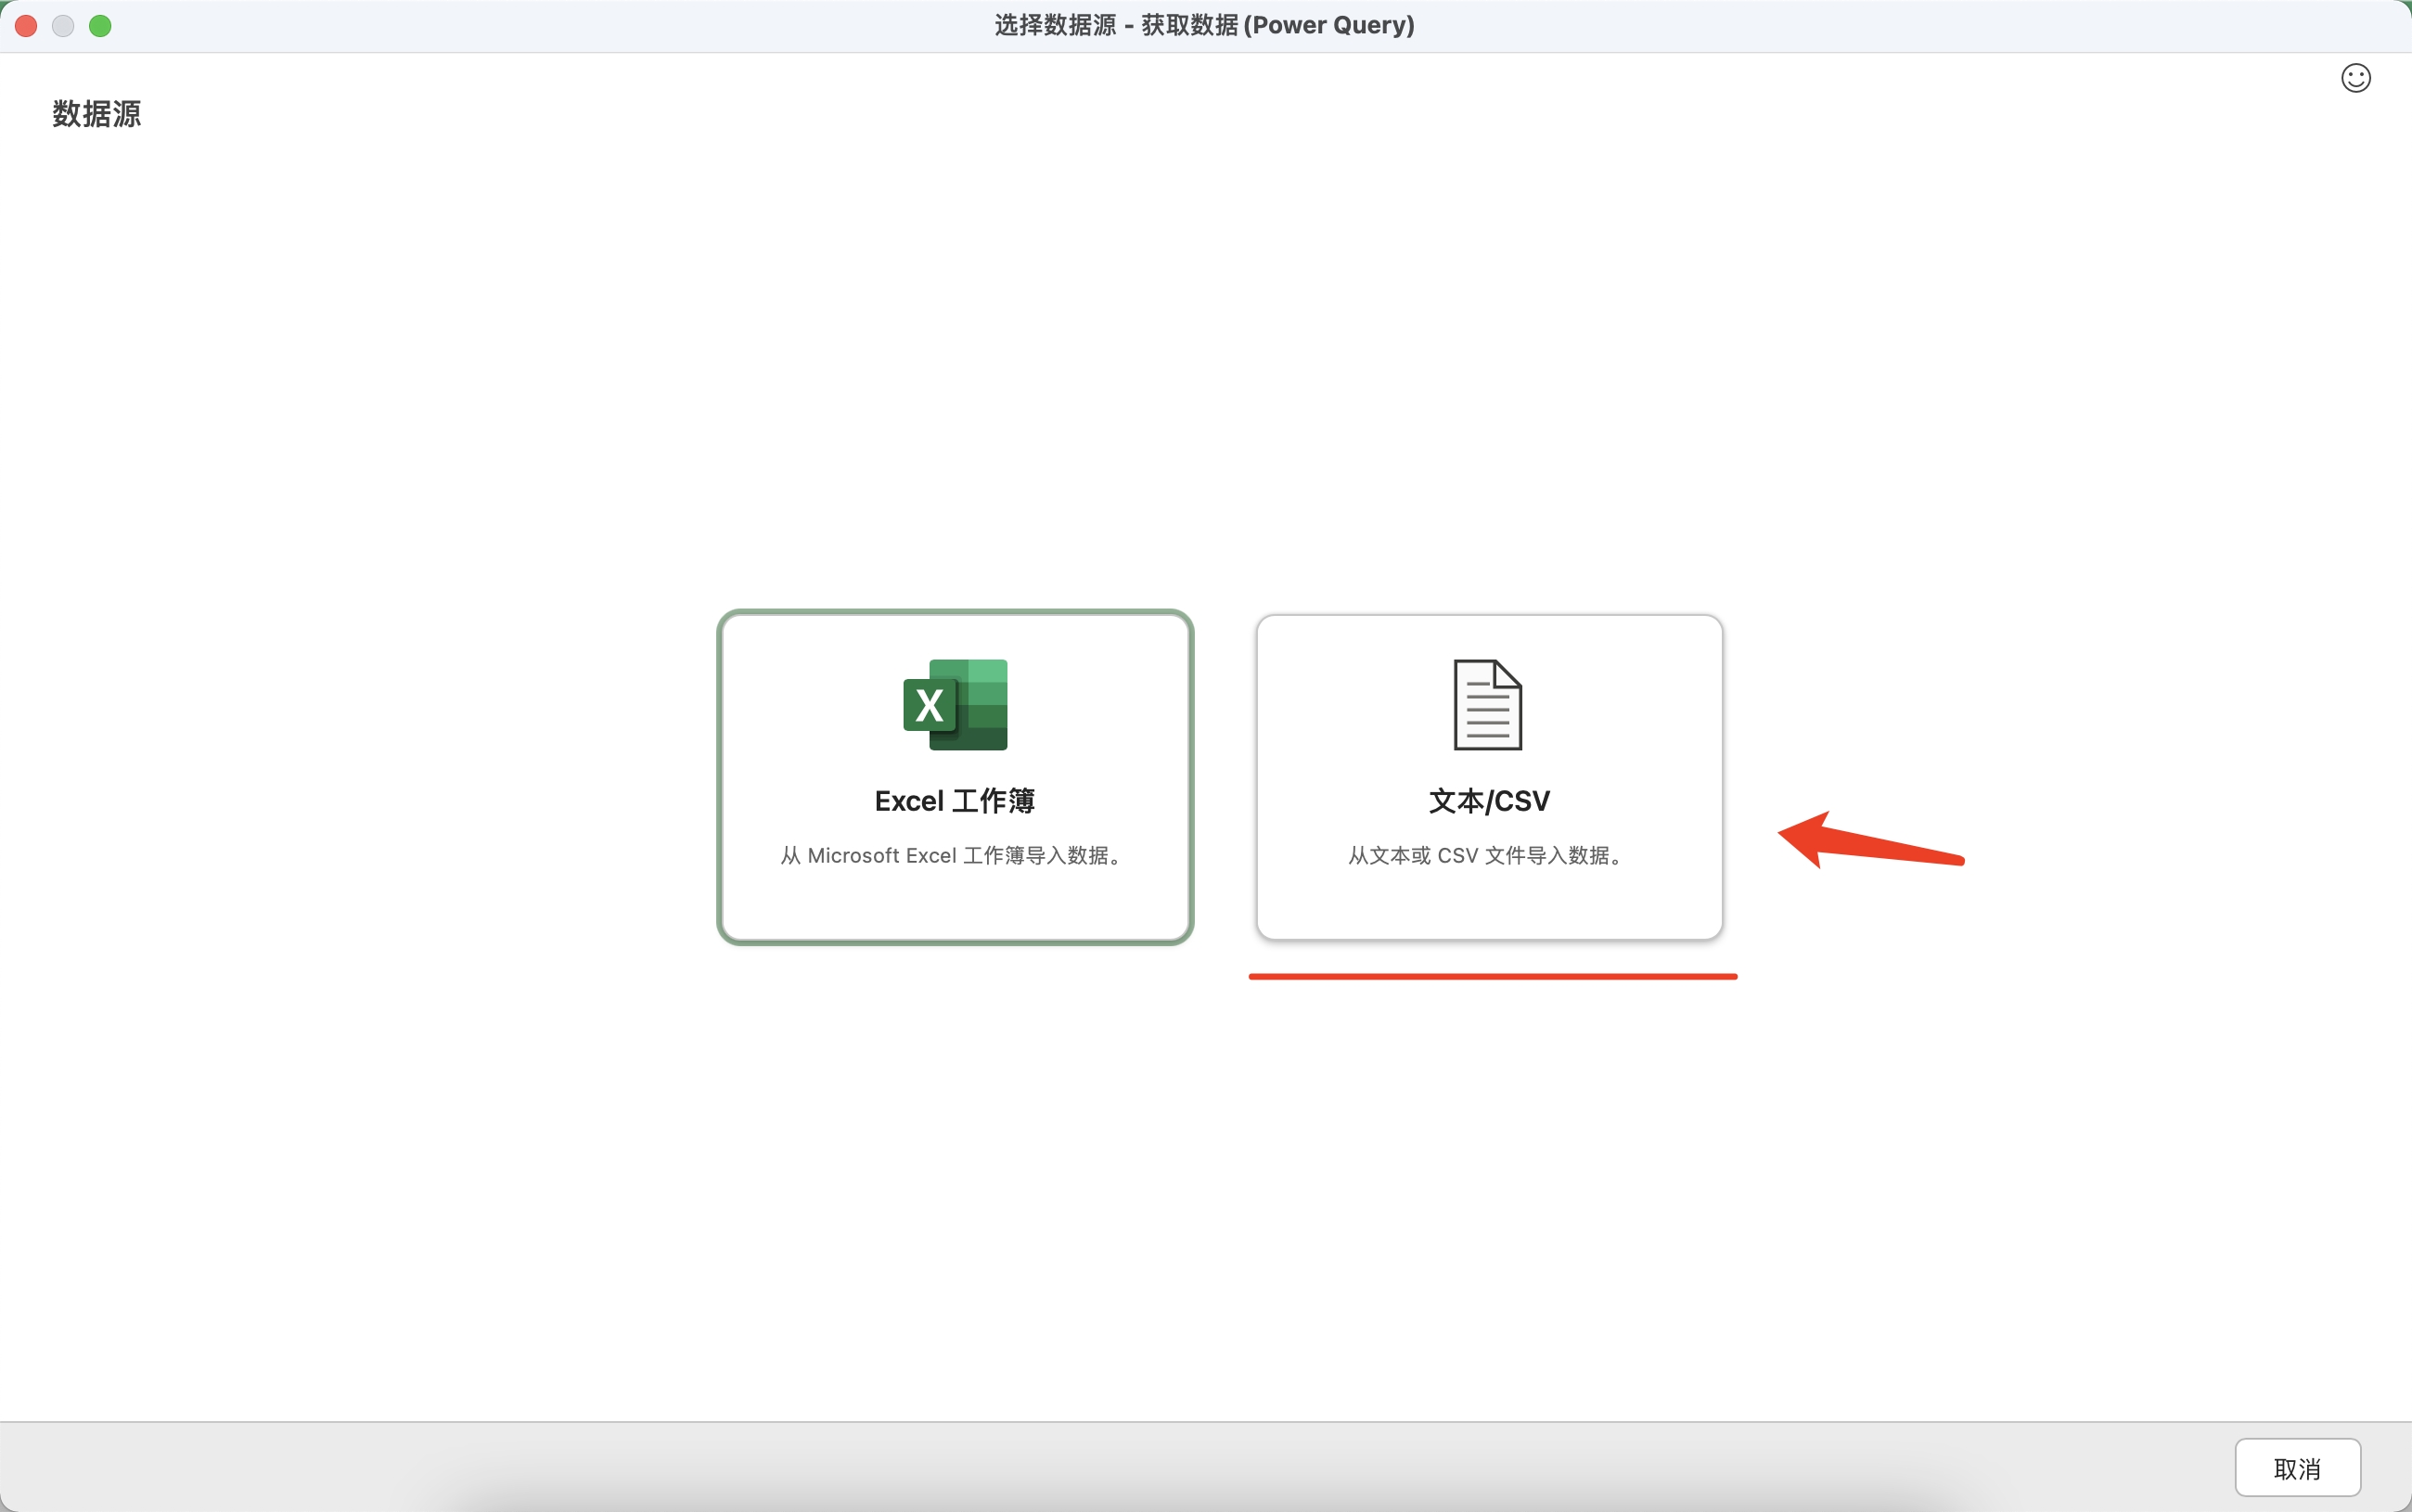
- Click "Browse" and select the CSV file you just downloaded.
- Preview file data, the default file raw format is (UTF-8), delimiters are commas, and data type monitoring is based on the first 200 lines.
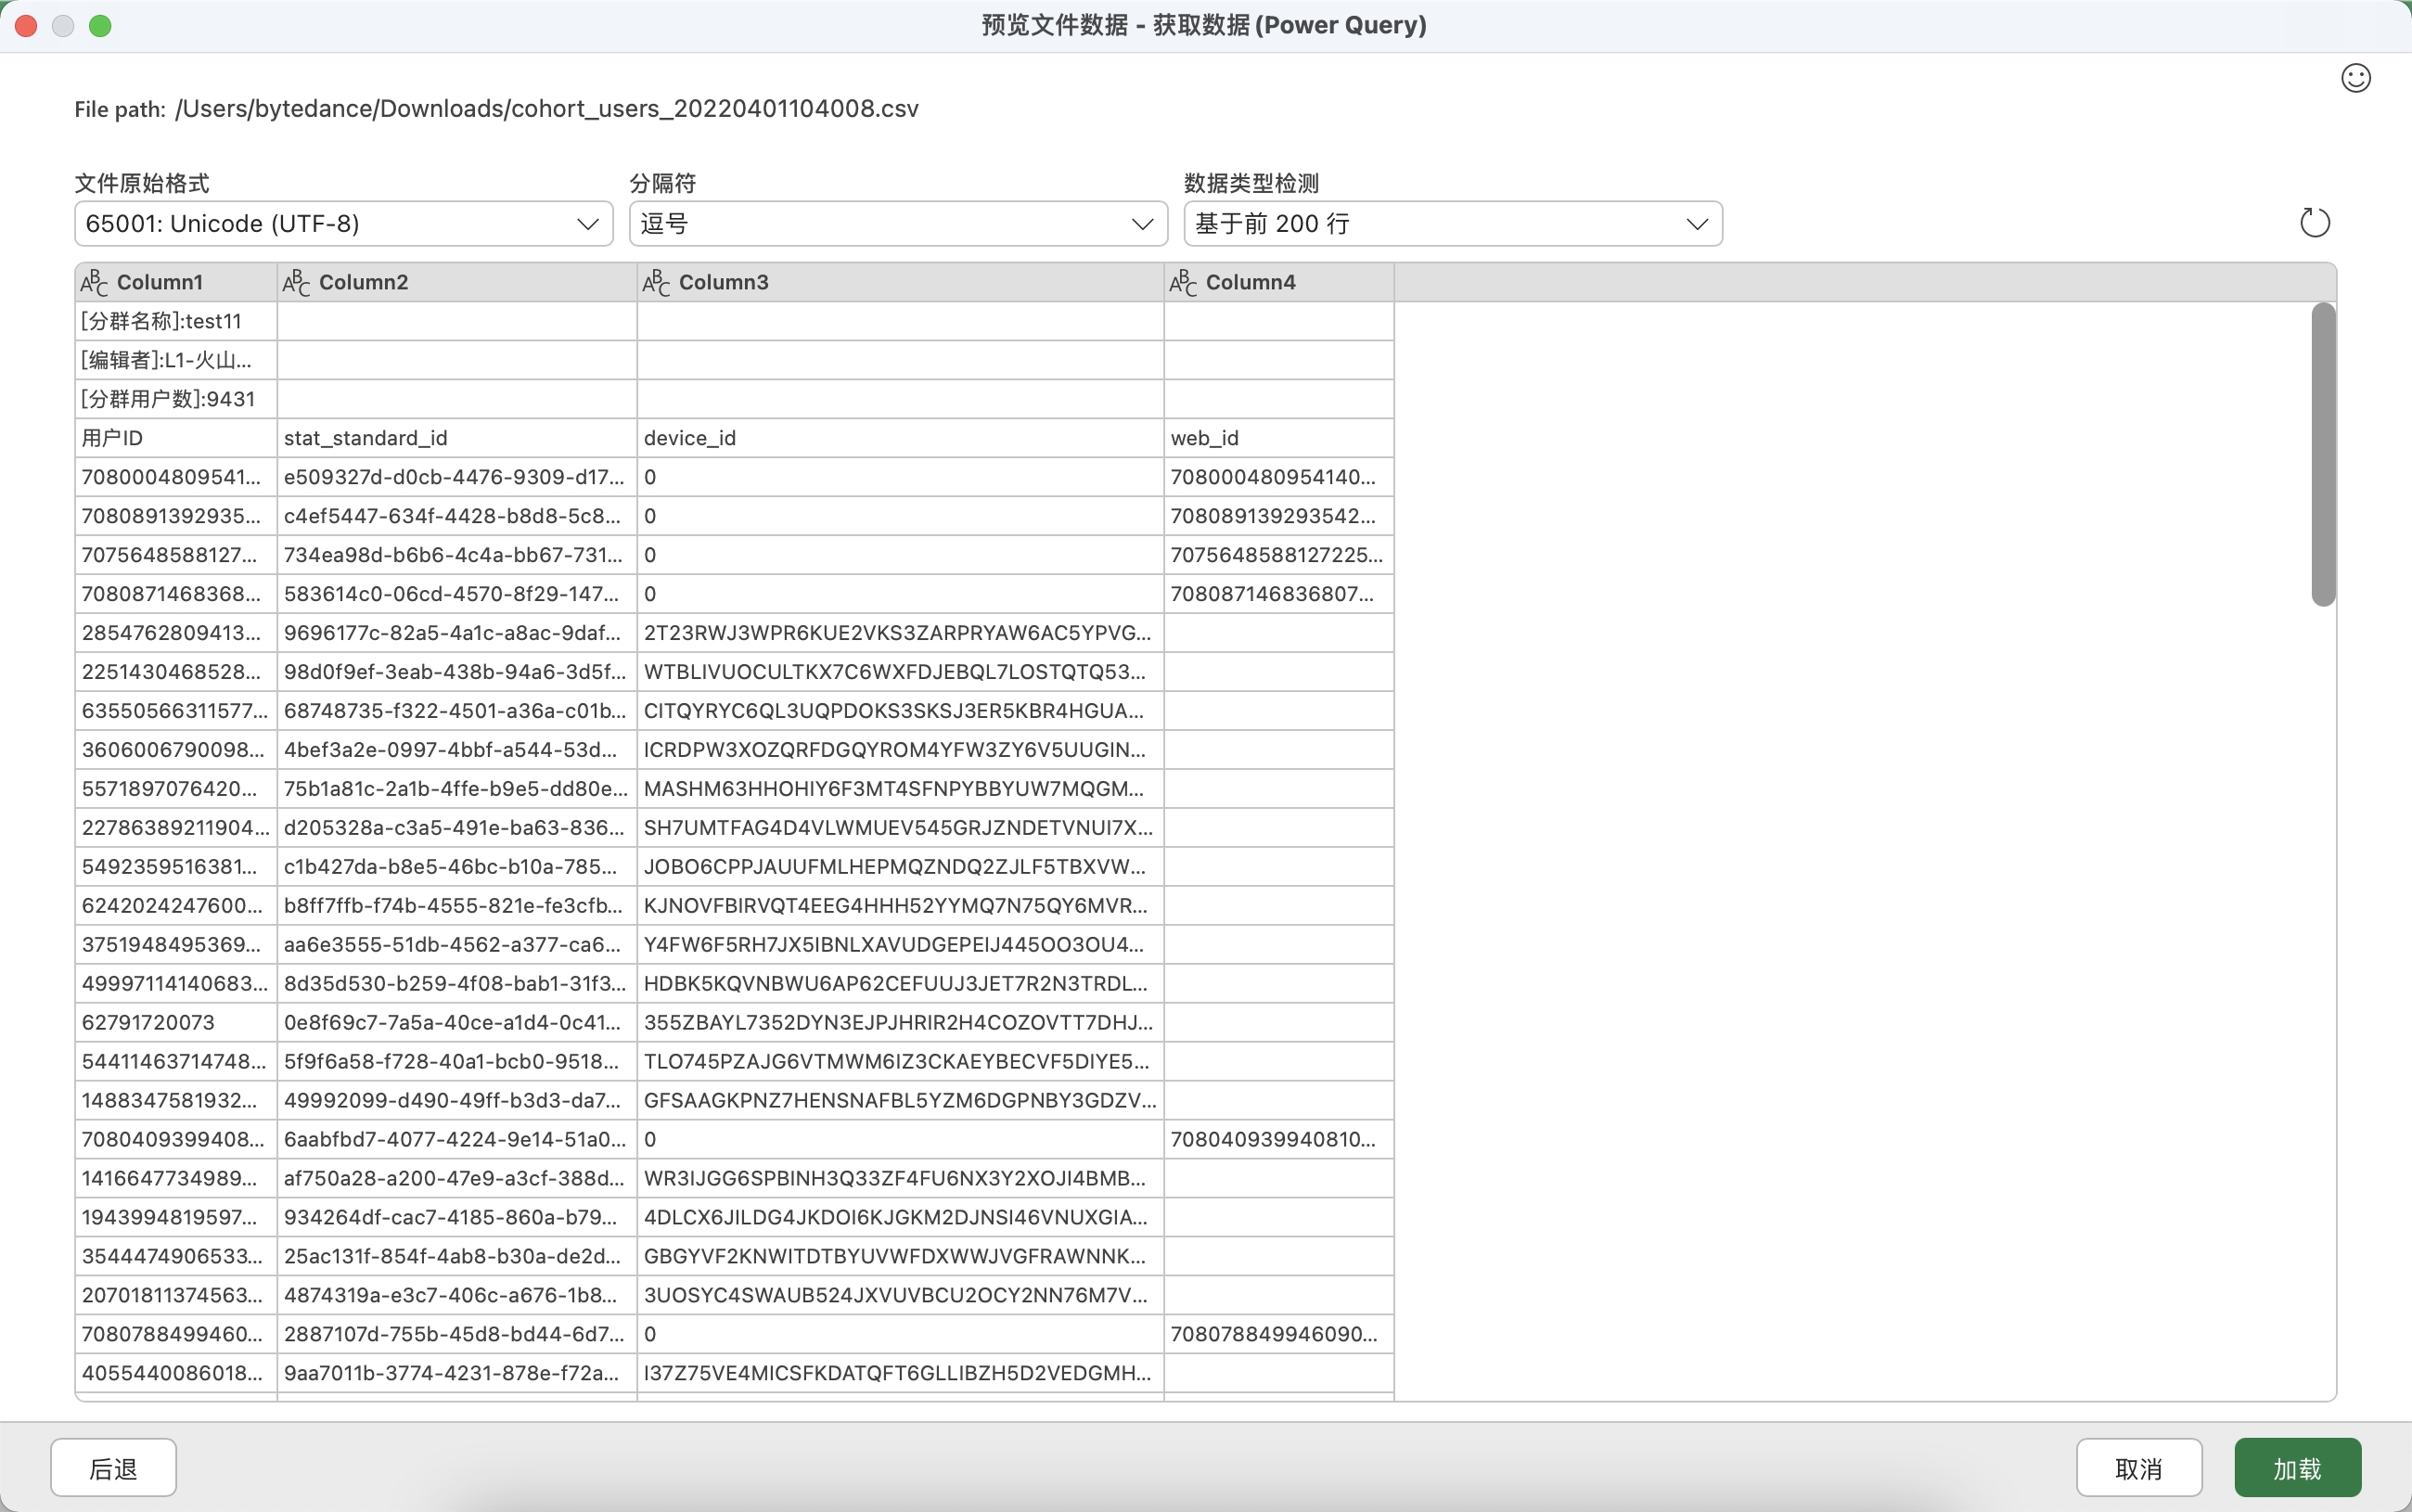
- Click Load to complete the data import.
Option 3: Open it through other software first and save the Excel format
MacOS Numbers, Lark documents, or text editors do not automatically convert extremely long numbers. You can use these software to open CSV, then save the file to Excel format, and then open it with Excel or WPS to display it correctly.
This situation is also more convenient for small files. But if the file is large and slow to process, consider importing it directly into Excel.
