Cache for Redis
Cache for Redis


Document

- Documentation
 Cache for RedisFAQErrors and exceptionsWhy does Redis still experience high latency even with low average QPS and resource utilization?
 Copy page
 Download PDF
Errors and exceptions
Why does Redis still experience high latency even with low average QPS and resource utilization?
Copy pageDownload PDFWhy does Redis still experience high latency even with low average QPS and resource utilization?
When using Cache for Redis, you might encounter situations where the average QPS, CPU utilization, or network bandwidth shown in Monitoring are not high, but the application occasionally experiences high P99 latency, or even request timeouts. When checking the slow log, you might not find any corresponding slow commands.
Micro Burst requests are one possible reason for this phenomenon. When a large number of requests arrive at the same processing node or shard within a very short period, exceeding its processing capability during that time, some requests need to wait in a queue. Even if each command executes quickly, subsequent requests may experience higher latency due to waiting. The average value over a longer statistical period cannot fully reflect this short-term congestion.
This topic explains this mechanism and introduces troubleshooting and mitigation methods. The values in this article are for demonstrating principles and do not represent any performance guarantees for instance specifications. Specific metric names, collection periods, and diagnostic features are subject to the documentation of the cloud product used.
I. Why does congestion still occur even with a low average load?
1. Average QPS does not reflect whether requests arrive in bursts
QPS typically represents the number of requests within a unit of time. It is calculated by dividing the difference in counter values during a collection period by the period duration:
Average QPS during the statistical period = Number of requests during the statistical period ÷ Duration of the statistical period (seconds)
Assume the collection period is one minute, and there are 6,000 requests within that minute; then the average QPS is 100. However, these 6,000 requests could either be evenly distributed throughout the minute or issued in a concentrated burst within tens of milliseconds. The average QPS is the same for both scenarios, but the demands on the system's instantaneous processing capability differ significantly.
Besides QPS, metrics such as CPU utilization and network throughput can also be affected by time aggregation: Resources might be busy for a short period, then idle for a long time, resulting in a still low average value.
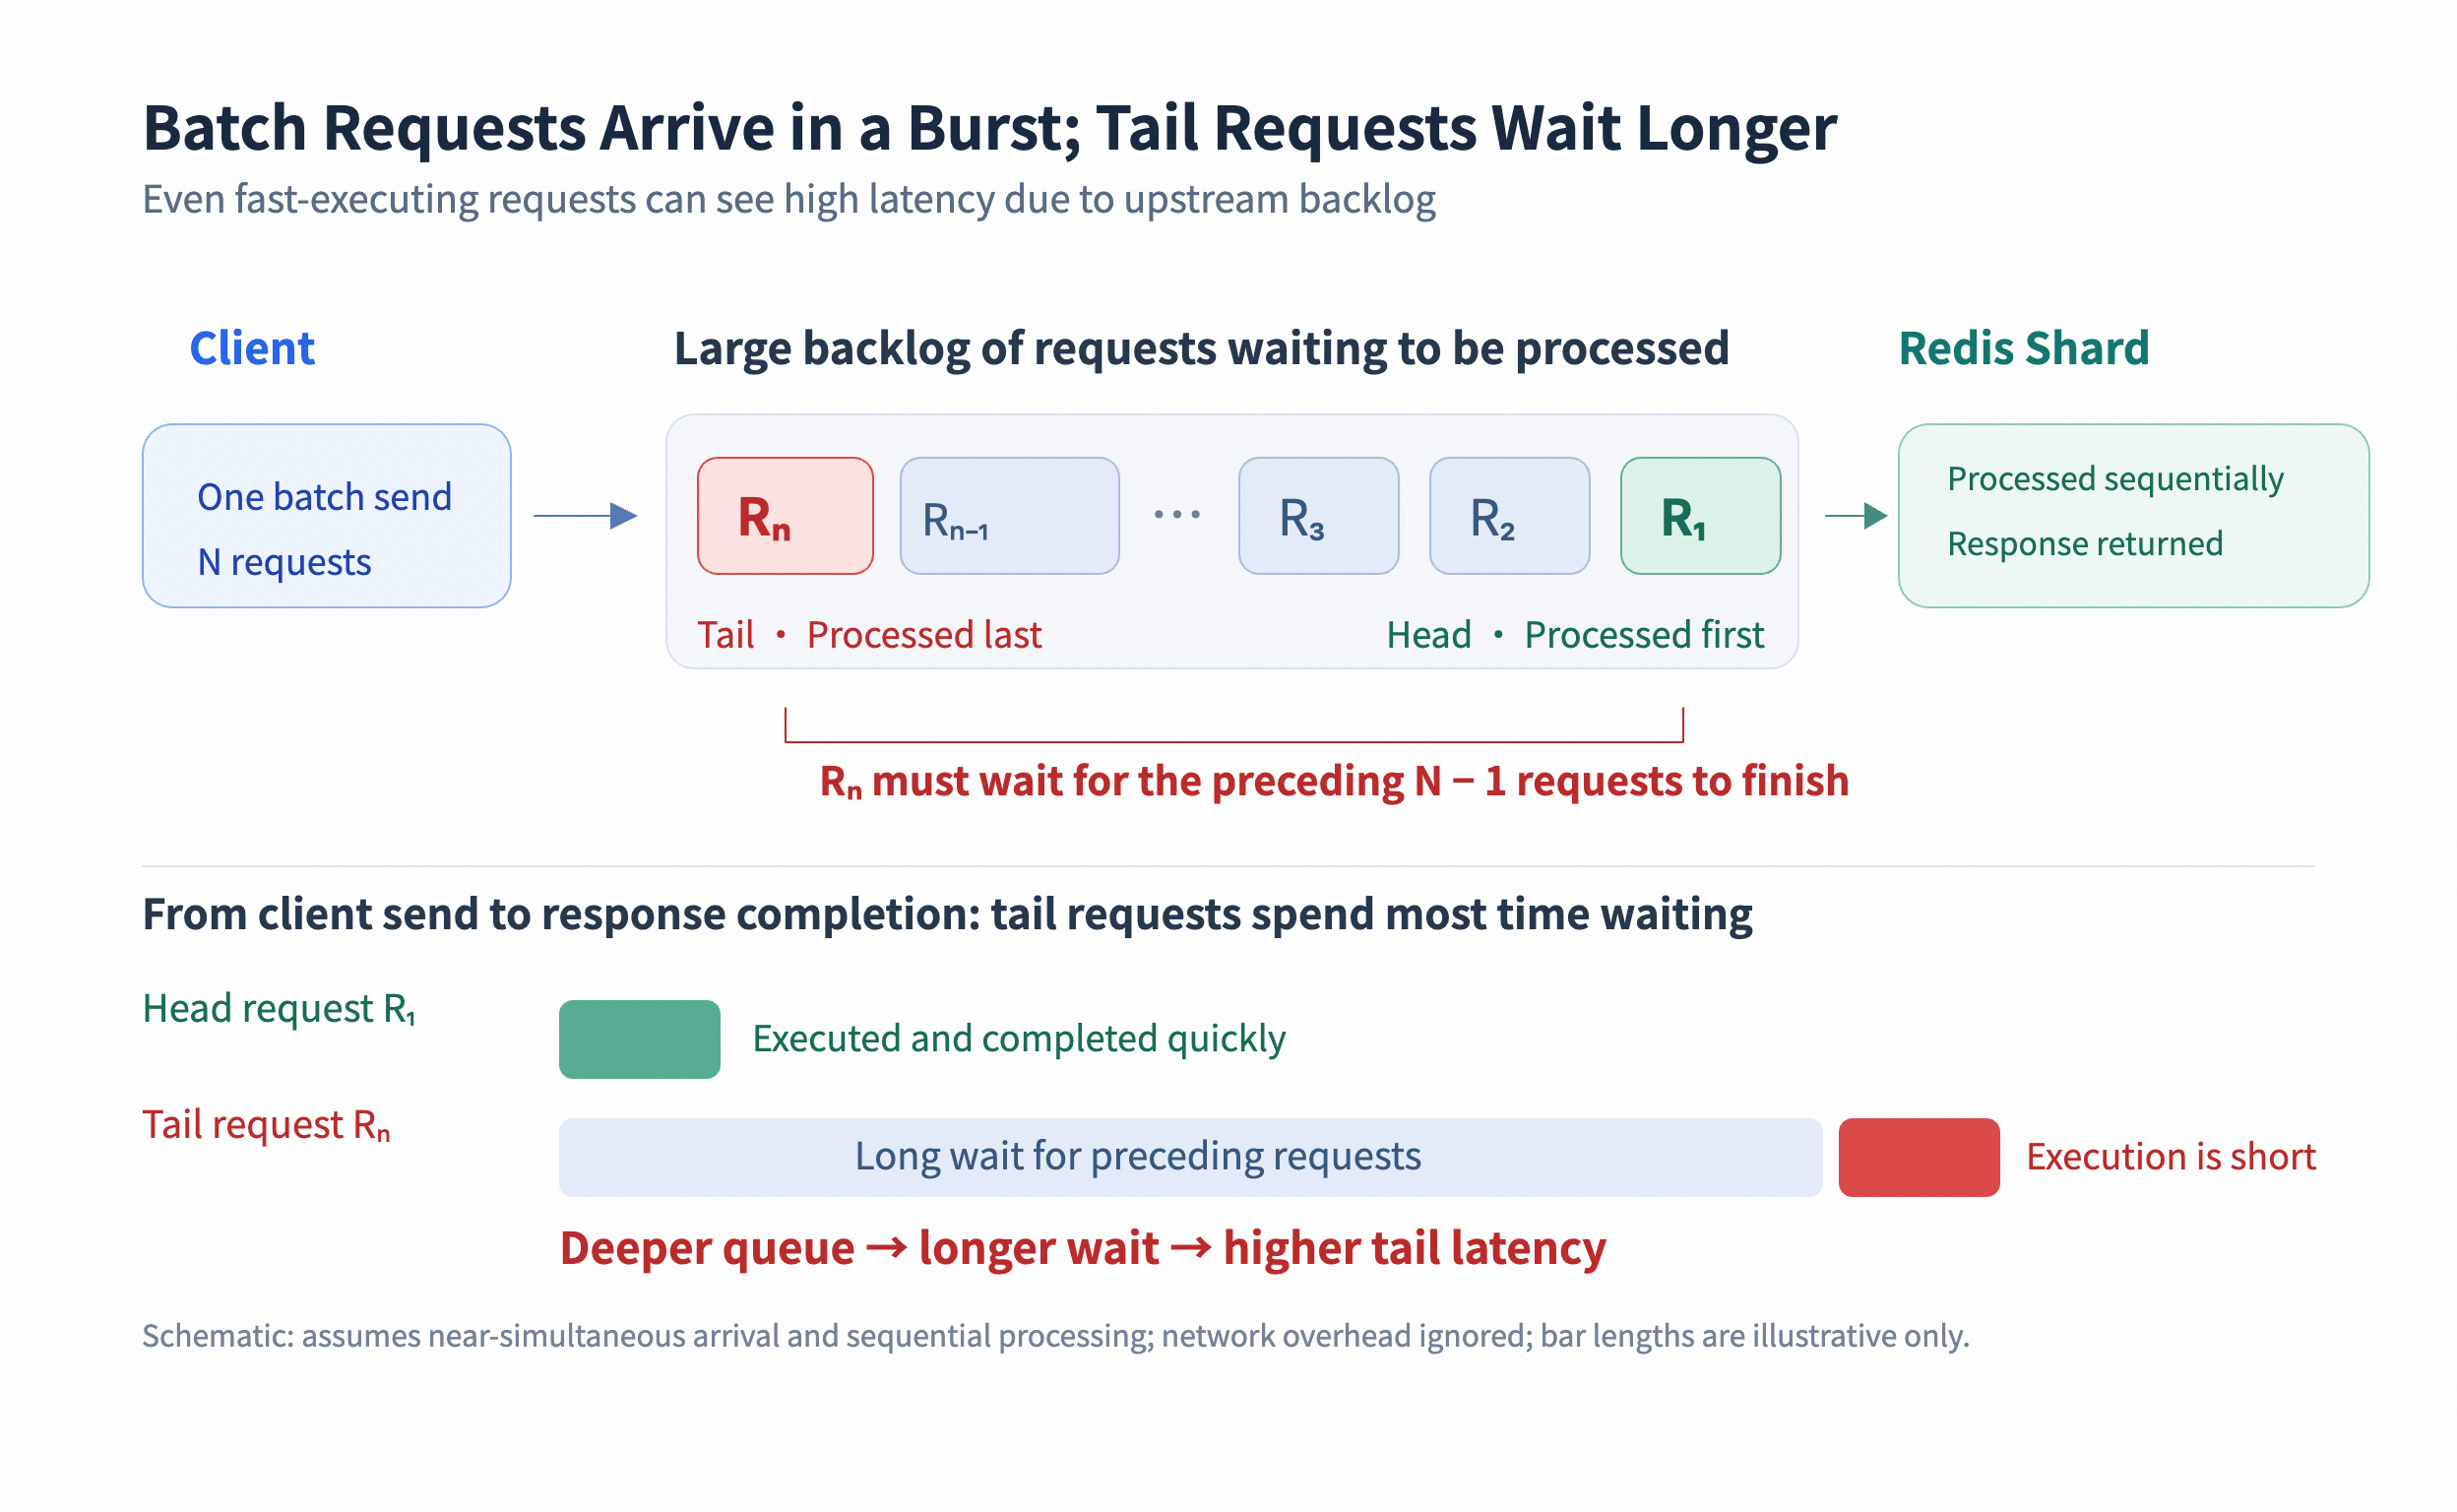
When clients send a large number of requests in batches within a short period, these requests need to be queued and processed sequentially on Redis. Although the processing time for a single request is very short, requests at the end of the queue spend most of their time waiting for preceding requests to be processed, as shown in the figure below:
2. Calculation example: Average QPS is approximately 83, but tail latency approaches 40 milliseconds
Assume a single Redis shard can process 100,000 requests per second, with an average request processing time of 10 microseconds. Starting from a certain point in time, the client sends 5,000 requests within 10 milliseconds, with no further requests in that minute. To simplify calculations, we temporarily exclude additional time consumed by network transmission, proxy forwarding, and client response processing.
The 5,000th request is sent at approximately the 10-millisecond mark, but it needs to wait for previous requests to be processed and will only be completed around the 50-millisecond mark. Therefore, under the simplified conditions mentioned above, the approximate time elapsed from client transmission to complete reception and processing of the response by the client is:
Latency of the last request ≈ 5,000 × 10 microseconds − 10 milliseconds
= 50 milliseconds − 10 milliseconds
= 40 milliseconds
Although this request itself only takes 10 microseconds to execute, after factoring in queue waiting time, the client-perceived latency has reached approximately 40 milliseconds. In actual scenarios, we also need to account for the time consumed by network transmission, proxy forwarding, and client response processing. At this point, if we observe the QPS and latency monitoring, we can see:
Observe metrics | Computed results |
QPS | About 83.3 |
Request response latency | About 40 ms |
The same batch of traffic can manifest as 'an average QPS of only about 83 per minute' or result in 'a tail-end request latency of approximately 40 milliseconds'. These two results are not contradictory; they respectively describe the average throughput over a longer period and the waiting experienced by individual requests.
II. Which business patterns are prone to short-term bursts?
These patterns are merely troubleshooting clues; whether congestion occurs depends on the concentration of requests, command overhead, and the actual processing capacity of the target node.
III. How to mitigate high latency caused by short-term bursts?
1. Smooth request sending speed
Break down concentrated tasks into smaller batches, stagger scheduled task execution times, or add random jitter to the startup and retry times of different clients. When rate limiting is required, simultaneously constrain the number of requests that can be released within a short period to avoid "total volume controlled per second, but all released at the beginning of that second."
2. Use appropriate configurations for clients
Based on business concurrency and latency targets, appropriately set the client's connection reuse method, connection pool size, and wait timeout. For Spring Data Redis + Lettuce, if it is confirmed that shared connections have contention or response backlog, consider evaluating the use of an underlying connection pool.
For specific configuration methods, examples, and scope of application, refer to Lettuce connection pool configuration guide.
3. Select an appropriate batch for Pipeline
Pipeline can reduce round-trip latency and improve throughput, but excessively large batches or multiple clients submitting batches simultaneously may also lead to more concentrated traffic. It is recommended to determine the batch size based on the number of commands, request and response bytes, batch concurrency, and tail latency targets, and validate it with actual business loads.
- In Cache for Redis instances with proxy mode, the pipeline convergence mode has been adopted between the Proxy node and the Server node, so it is recommended to reduce the use of pipeline when using this type of instance.
- Pipeline can, to some extent, reduce the utilization of the cache database: the total throughput of a database system under continuous "peak shaving and valley filling" access will, on average, be higher than during short-term bursts (Micro Burst). For a detailed modeling process, refer to queueing theory.
warning
- The pipeline of cache databases, such as the implementation of pipeline in community edition Redis/Valkey, does not guarantee atomicity or transactional properties in the past, present, or future. Correctly use standard Redis/Valkey MULTI/EXEC to describe atomic and transactional operations.
- If a pipeline with excessive queue depth is selected, it is recommended that the business selects and increases an appropriate read timeout. Due to potential queuing when processing requests during microbursts, requests at the end of the queue must wait for all accumulated requests to complete before returning, which manifests as an increased RT on the business side.
4. Reduce hotspots and single request overhead
Optimize time-consuming commands, scripts, and large-scale data reads to reduce large responses. For hotspot access, when business semantics allow, use local caching or data sharding to reduce concentrated load on the same shard.
5. Increase processing capacity based on actual bottlenecks
If the target cannot be met even after traffic smoothing, select specifications that enhance single-shard processing or network capabilities based on the bottleneck, or increase shards and improve data distribution. Increasing shards is only effective when traffic can be distributed; requests for the same hotspot key usually will not be automatically evenly distributed by merely increasing the number of shards.
Capacity evaluation should use realistic command combinations, data sizes, concurrency, and burst patterns, while simultaneously verifying P99, timeout rates, and backlog recovery times. Relying solely on average QPS or maximum throughput under stable traffic might underestimate the buffer required for latency-sensitive applications.
6. Control retry amplification
For retriable errors, set a maximum number of retries, implement backoff and random jitter, and ensure operations are idempotent. A client timeout does not mean the server has canceled the original request; immediate and frequent retries may further increase the backlog.
Simply increasing the timeout duration will not improve processing capacity or eliminate queuing. Timeout settings should be designed in conjunction with the business's allowed waiting time, retry strategy, and overall call deadline.
Last updated: 2026.10.10 17:11:22
All rights reserved © Beijing Volcano Engine Technology Co., Ltd2024
