托管 Prometheus
托管 Prometheus
托管 Prometheus


文档指南
请输入


产品动态
Prometheus 基础知识
用户指南
工作区
告警中心
接入指南
容器与自建集群接入
自建 Kubernetes 集群接入
最佳实践
Prometheus 数据采集与接入
资源与业务监控
工作区数据写入和查询
多渠道告警通知
API 参考
工作区
告警中心
联系人
告警规则
告警静默策略
SDK 参考
指标参考
容器服务指标
常见问题
视频帮助
- 文档首页
 托管 Prometheus最佳实践资源与业务监控监控腾讯云资源
 复制全文
 下载 pdf
监控腾讯云资源
 文档反馈
 问问助手
托管 Prometheus 服务提供基于 Exporter 的方式来接入腾讯云产品的监控指标,本文为您介绍如何在 VKE 集群中部署腾讯云 Exporter,并实现对腾讯云产品的监控。
背景信息
基本信息
腾讯云支持通过开源监控 Exporter(qcloud exporter),将腾讯云产品的监控指标自动批量导出为 Prometheus 格式。您可以使用托管 Prometheus 拉取 qcloud exporter 导出的指标,实现在火山引擎对腾讯云资源的监控。
采集配置
腾讯云 Exporter 的采集配置和指标转换功能,通过如下配置来定义。
credential:
access_key: <YOUR_ACCESS_KEY> // 必选, 云API的SecretId
secret_key: <YOUR_ACCESS_SECRET> // 必选, 云API的SecretKey
region: <REGION> // 必选, 实例所在区域信息
rate_limit: 15 // 腾讯云监控拉取指标数据限制, 官方默认限制最大 20qps
// 整个产品纬度配置, 每个产品一个 item
products:
- namespace: QCE/CMONGO // 必选, 产品命名空间
all_metrics: true // 常用, 推荐开启, 导出支持的所有指标
all_instances: true // 常用, 推荐开启, 导出该region下的所有实例
extra_labels: [InstanceName,Zone] // 可选, 将实例的字段作为指标的lables导出
only_include_metrics: [Inserts] // 可选, 只导出这些指标, 配置时all_metrics失效
exclude_metrics: [Reads] // 可选, 不导出这些指标
only_include_instances: [cmgo-xxxxxxxx] // 可选, 只导出这些实例id, 配置时all_instances失效
exclude_instances: [cmgo-xxxxxxxx] // 可选, 不导出这些实例id
custom_query_dimensions: // 可选, 不常用, 自定义指标查询条件, 配置时all_instances,only_include_instances,exclude_instances失效, 用于不支持按实例纬度查询的指标
- target: cmgo-xxxxxxxx
statistics_types: [avg] // 可选, 拉取N个数据点, 再进行max、min、avg、last计算, 默认last取最新值
period_seconds: 60 // 可选, 指标统计周期
range_seconds: 300 // 可选, 选取时间范围, 开始时间=now-range_seconds, 结束时间=now
delay_seconds: 60 // 可选, 时间偏移量, 结束时间=now-delay_seconds
metric_name_type: 1 // 可选,导出指标的名字格式化类型, 1=大写转小写加下划线, 2=转小写; 默认2
reload_interval_minutes: 60 // 可选, 在all_instances=true时, 周期reload实例列表, 建议频率不要太频繁
// 单个指标纬度配置, 每个指标一个item
metrics:
- tc_namespace: QCE/CMONGO // 产品命名空间, 同namespace
tc_metric_name: Inserts // 云监控定义的指标名
tc_metric_rename: Inserts // 导出指标的显示名
tc_metric_name_type: 1 // 可选,导出指标的名字格式化类型, 1=大写转小写加下划线, 2=转小写; 默认1
tc_labels: [InstanceName] // 可选, 将实例的字段作为指标的lables导出
tc_myself_dimensions: // 可选, 同custom_query_dimensions
tc_statistics: [Avg] // 可选, 同statistics_types
period_seconds: 60 // 可选, 同period_seconds
range_seconds: 300 // 可选, 同range_seconds
delay_seconds: 60 // 可选, 同delay_seconds
实际配置时,主要需要修改以下内容:
- 配置云 API 的credential认证信息,包括access_key、secret_key和region。
- 配置产品products指标、实例导出信息。
例如:如果您需要采集并导出腾讯云 MongoDB 产品所有实例的指标信息,配置样例如下所示:
credential:
access_key: <YOUR_ACCESS_KEY> // 云API的SecretId
secret_key: <YOUR_ACCESS_SECRET> // 云API的SecretKey
region: "ap-guangzhou" // 实例所在区域信息
products:
- namespace: QCE/CMONGO // 产品命名空间
all_metrics: true // 导出支持的所有指标
all_instances: true // 导出region下的所有实例
extra_labels: [InstanceName,Zone] // 将实例的字段作为指标的lables导出
前提条件
- 已注册并开通火山引擎容器服务(VKE)。
- 已创建托管 Prometheus 工作区,详情请参见 创建工作区。
- VKE 集群已接入托管 Prometheus,详情请参见 容器服务接入。
配置步骤
步骤一:构建腾讯云 Exporter 镜像
- 使用如下命令,构建腾讯云 Exporter 镜像,方便部署在容器服务 VKE 集群中。
git clone https://github.com/tencentyun/tencentcloud-exporter.git
cd tencentcloud-exporter
# 构建镜像
docker build -t <image> .
步骤二:在集群中部署 Exporter
- 登录 容器服务控制台。
- 单击左侧导航栏中的 集群。
- 在集群列表页面,单击需要配置的目标集群。
- 在集群管理页面的左侧导航栏中,选择 配置管理 > 配置项,单击 使用 Yaml 创建,配置 Exporer 使用的配置项。其中,access_key、secret_key和region字段,需要根据您的实际情况进行修改。更多配置项详情,请参见 采集配置。
apiVersion: v1
kind: ConfigMap
metadata:
name: qcloud-exporter-config
namespace: default
data:
product.yaml: |-
credential:
access_key: <YOUR_ACCESS_KEY>
secret_key: <YOUR_ACCESS_SECRET>
region: <REGION>
products:
- namespace: QCE/CMONGO
all_metrics: true
all_instances: true
extra_labels: [InstanceName,Zone]
说明
请注意修改上述配置中的云 API credential认证信息,包括access_key、secret_key和region。
- 在集群管理页面的左侧导航栏中,单击 工作负载 > 无状态负载,单击 使用 Yaml 创建,在集群中部署 Exporter。
apiVersion: apps/v1
kind: Deployment
metadata:
name: qcloud-exporter
namespace: default
spec:
replicas: 1
selector:
matchLabels:
app: qcloud-exporter
strategy:
rollingUpdate:
maxSurge: 25%
maxUnavailable: 25%
type: RollingUpdate
template:
metadata:
labels:
app: qcloud-exporter
spec:
containers:
- args:
- --config.file=/usr/local/etc/product.yaml
image: <image>
imagePullPolicy: IfNotPresent
name: exporter
ports:
- containerPort: 9123
name: http
protocol: TCP
terminationMessagePath: /dev/termination-log
terminationMessagePolicy: File
volumeMounts:
- mountPath: /usr/local/etc
name: config
readOnly: true
dnsPolicy: ClusterFirst
restartPolicy: Always
schedulerName: default-scheduler
securityContext: {}
terminationGracePeriodSeconds: 30
volumes:
- configMap:
defaultMode: 420
name: qcloud-exporter-config
name: config
- 在集群管理页面的左侧导航栏中,选择 服务与路由 > 服务,单击 使用 Yaml创建,配置 Exporter 对应的服务。
apiVersion: v1
kind: Service
metadata:
name: qcloud-exporter
namespace: default
labels:
app: qcloud-exporter
spec:
ports:
- name: http
port: 9123
protocol: TCP
targetPort: 9123
selector:
app: qcloud-exporter
type: ClusterIP
步骤三:配置采集规则
- 在集群管理页面的左侧导航栏中,选择 工作负载 > 对象浏览器,单击 使用 Yaml 创建,通过 ServiceMonitor 配置采集规则。
- 在 类型 下拉菜单中选择 自定义。
- 在 Yaml 配置框内输入 Yaml 配置。
apiVersion: monitoring.coreos.com/v1
kind: ServiceMonitor
metadata:
name: qcloud-exporter # 填写一个唯一名称
namespace: default # 配置 ServiceMonitor 命名空间
labels:
volcengine.vmp: "true" # 配置 ServiceMonitor 的标签,允许被 Prometheus-agent 发现
spec:
endpoints:
- interval: 60s
port: http # 配置服务端口名称
path: /metrics # 填写指标暴露的 URI 路径,不填默认为 /metrics
namespaceSelector:
any: true
selector:
matchLabels:
app: qcloud-exporter # 配置服务的 Label 值,以定位目标服务
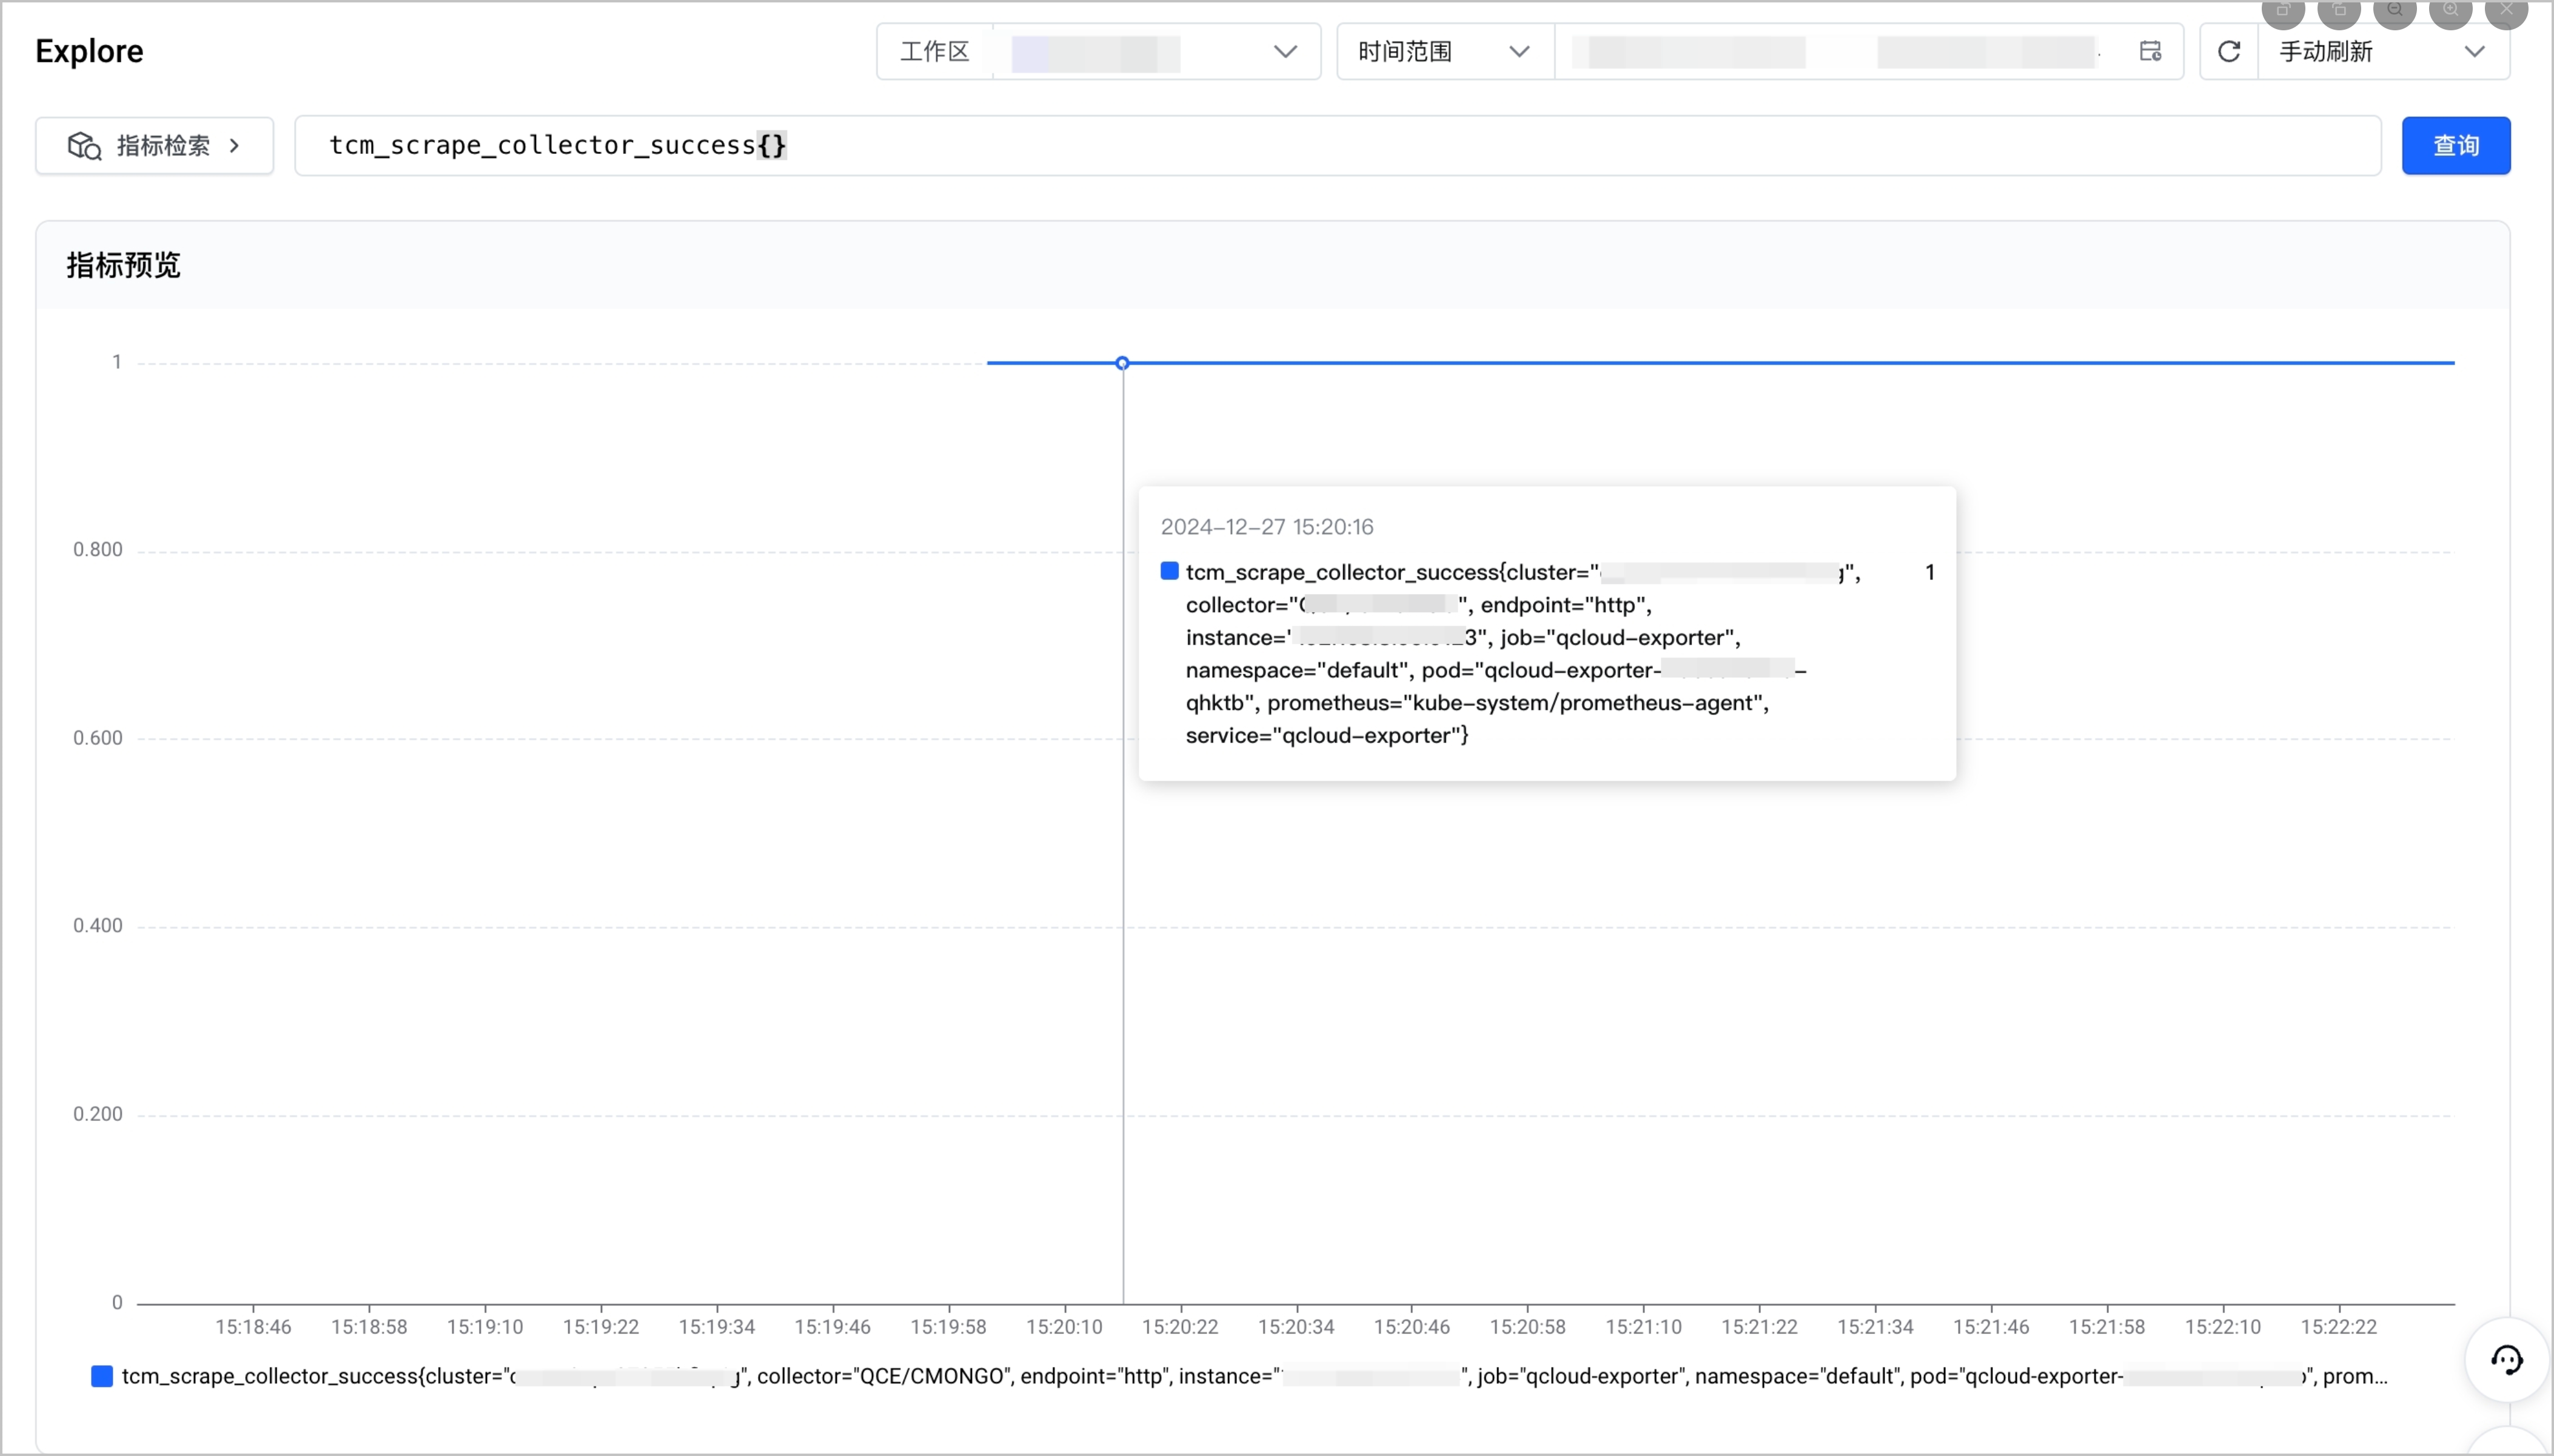
结果验证
最近更新时间:2025.09.03 15:13:02
这个页面对您有帮助吗?
有用
有用
无用
无用