RDS for MySQL
RDS for MySQL


Document

- Documentation
 RDS for MySQLTroubleshootingHow to solve the problem of high memory usage
 Copy page
 Download PDF
Troubleshooting
How to solve the problem of high memory usage
Copy pageDownload PDFHow to solve the problem of high memory usage
When using RDS for MySQL, a high memory usage rate can lead to a risk of memory exhaustion. This article describes several common causes and their solutions.
Confirming the problem
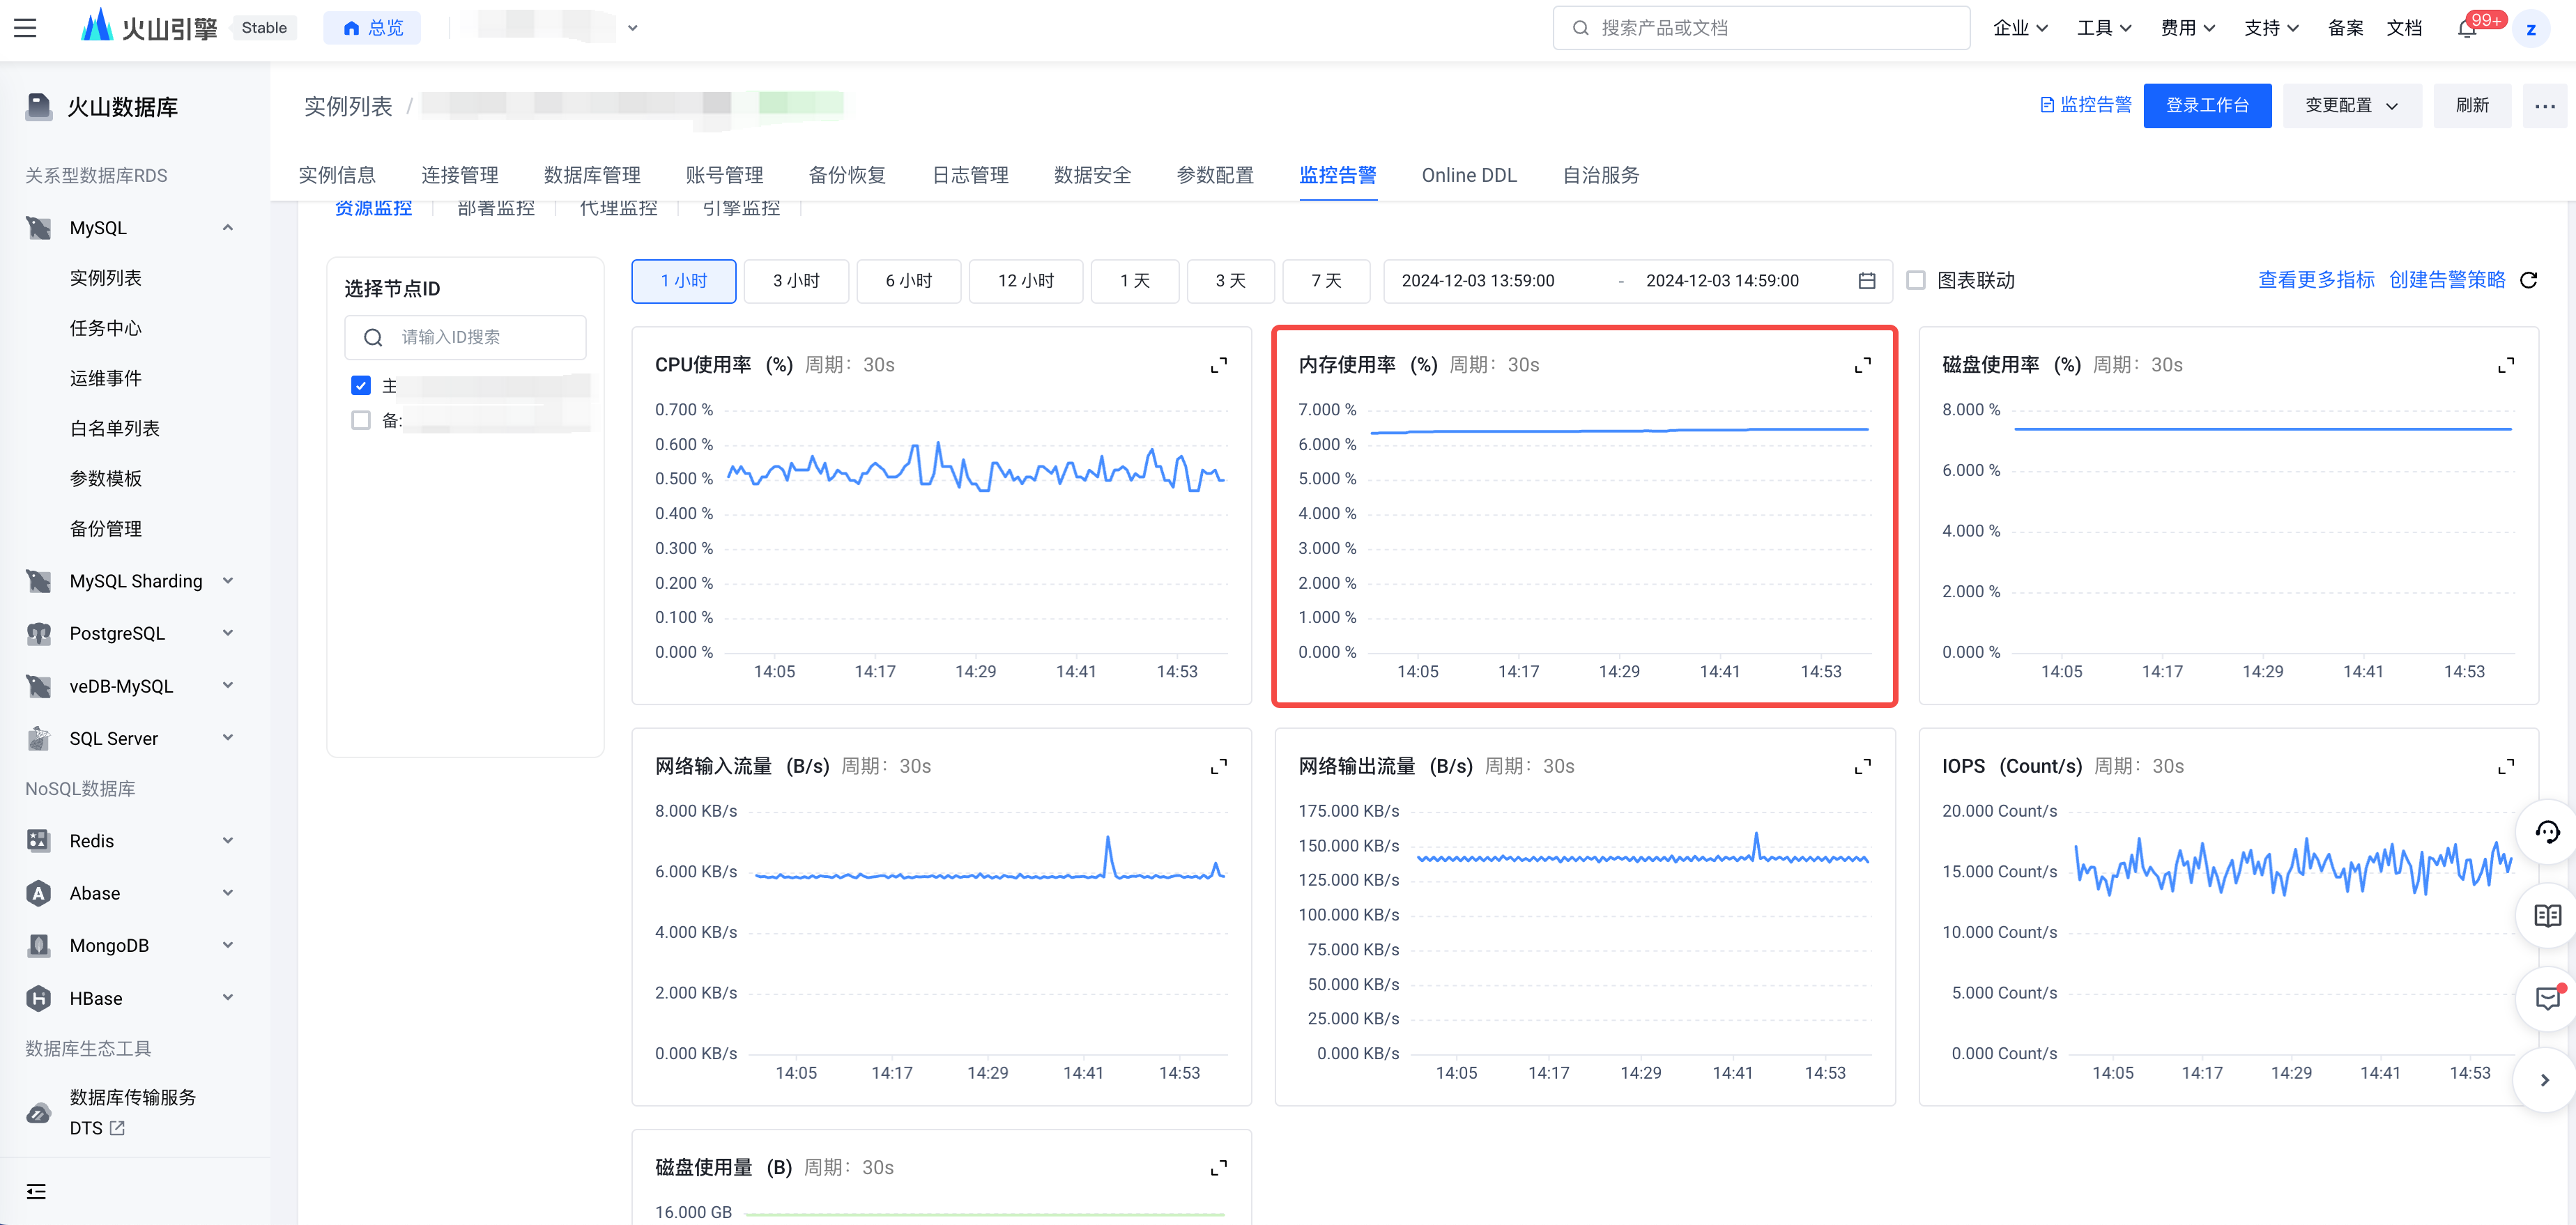
You can confirm the current memory usage rate of the instance by viewing the monitoring item for instance memory usage rate.
- On the Instances page, click the instance name of the target instance to enter the Instances page.
- Click the Monitoring and alarm tab at the top of the page.
- Under the Resource monitoring category, view the Memory usage rate.
Quick mitigation
If the memory usage rate exceeds 90% for a long time and shows no downward trend, you can quickly restore instance performance through the following two methods.
- Restart instance
- Switch to the primary node
warning
- MySQL has a dynamic memory balancing mechanism, so memory usage below 90% can be ignored. We also recommend setting the memory usage alert threshold to at least 90%.
- RDS for MySQL provides a memory usage monitoring metric. You can configure an alert policy for your instance and set a threshold for this metric. When memory usage exceeds the threshold, you will receive an alert. For more information about creating alert policies, refer to Creating alert policies.
Cause analysis
The InnoDB Buffer Pool typically uses the most memory. While the Buffer Pool's maximum memory usage is limited by its configuration parameters, a significant amount of memory is also dynamically allocated and adjusted during request execution. This includes memory for temporary in-memory tables, the table cache, hash indexes, and row lock objects. For detailed information on memory usage and related parameter limits, refer to the official MySQL documentation.
Enable memory monitoring for the instance (Optional)
You can enable the memory monitoring feature of performance_schema to troubleshoot memory issues more easily. After you enable performance_schema, query tables with names starting with memory_summary in the performance_schema database to view memory usage. For example, the global memory usage analysis table is memory_summary_global_by_event_name.
Common queries:
tip
If you are not sensitive to query latency or the amount of hot data access is small, you can adjust the buffer pool size to reduce its usage and reserve more memory for dynamic SQL operations.
QPS increase
Cause analysis
First, confirm whether the traffic has changed and whether new SQL has been launched. A sudden increase in business traffic may lead to higher memory usage.
Path: log on to Database Workshop>Observation diagnosis>Performance monitoring>Total queries. For more information, refer to View performance monitoring metrics.

Solutions
Determine which SQL statements have excessive writes using the full SQL insight feature of the Database Workshop, and limit their execution frequency with SQL throttling.
tip
Full SQL insight and SQL throttling are currently invitation-only features of the Database Workshop. To use them, submit a ticket to apply.
- Locate SQL: Determine which SQL statements have excessive writes. Path for SQL insight: Log on to Database Workshop>Observation diagnosis>Full SQL insight. For more information, refer to Full SQL insight.
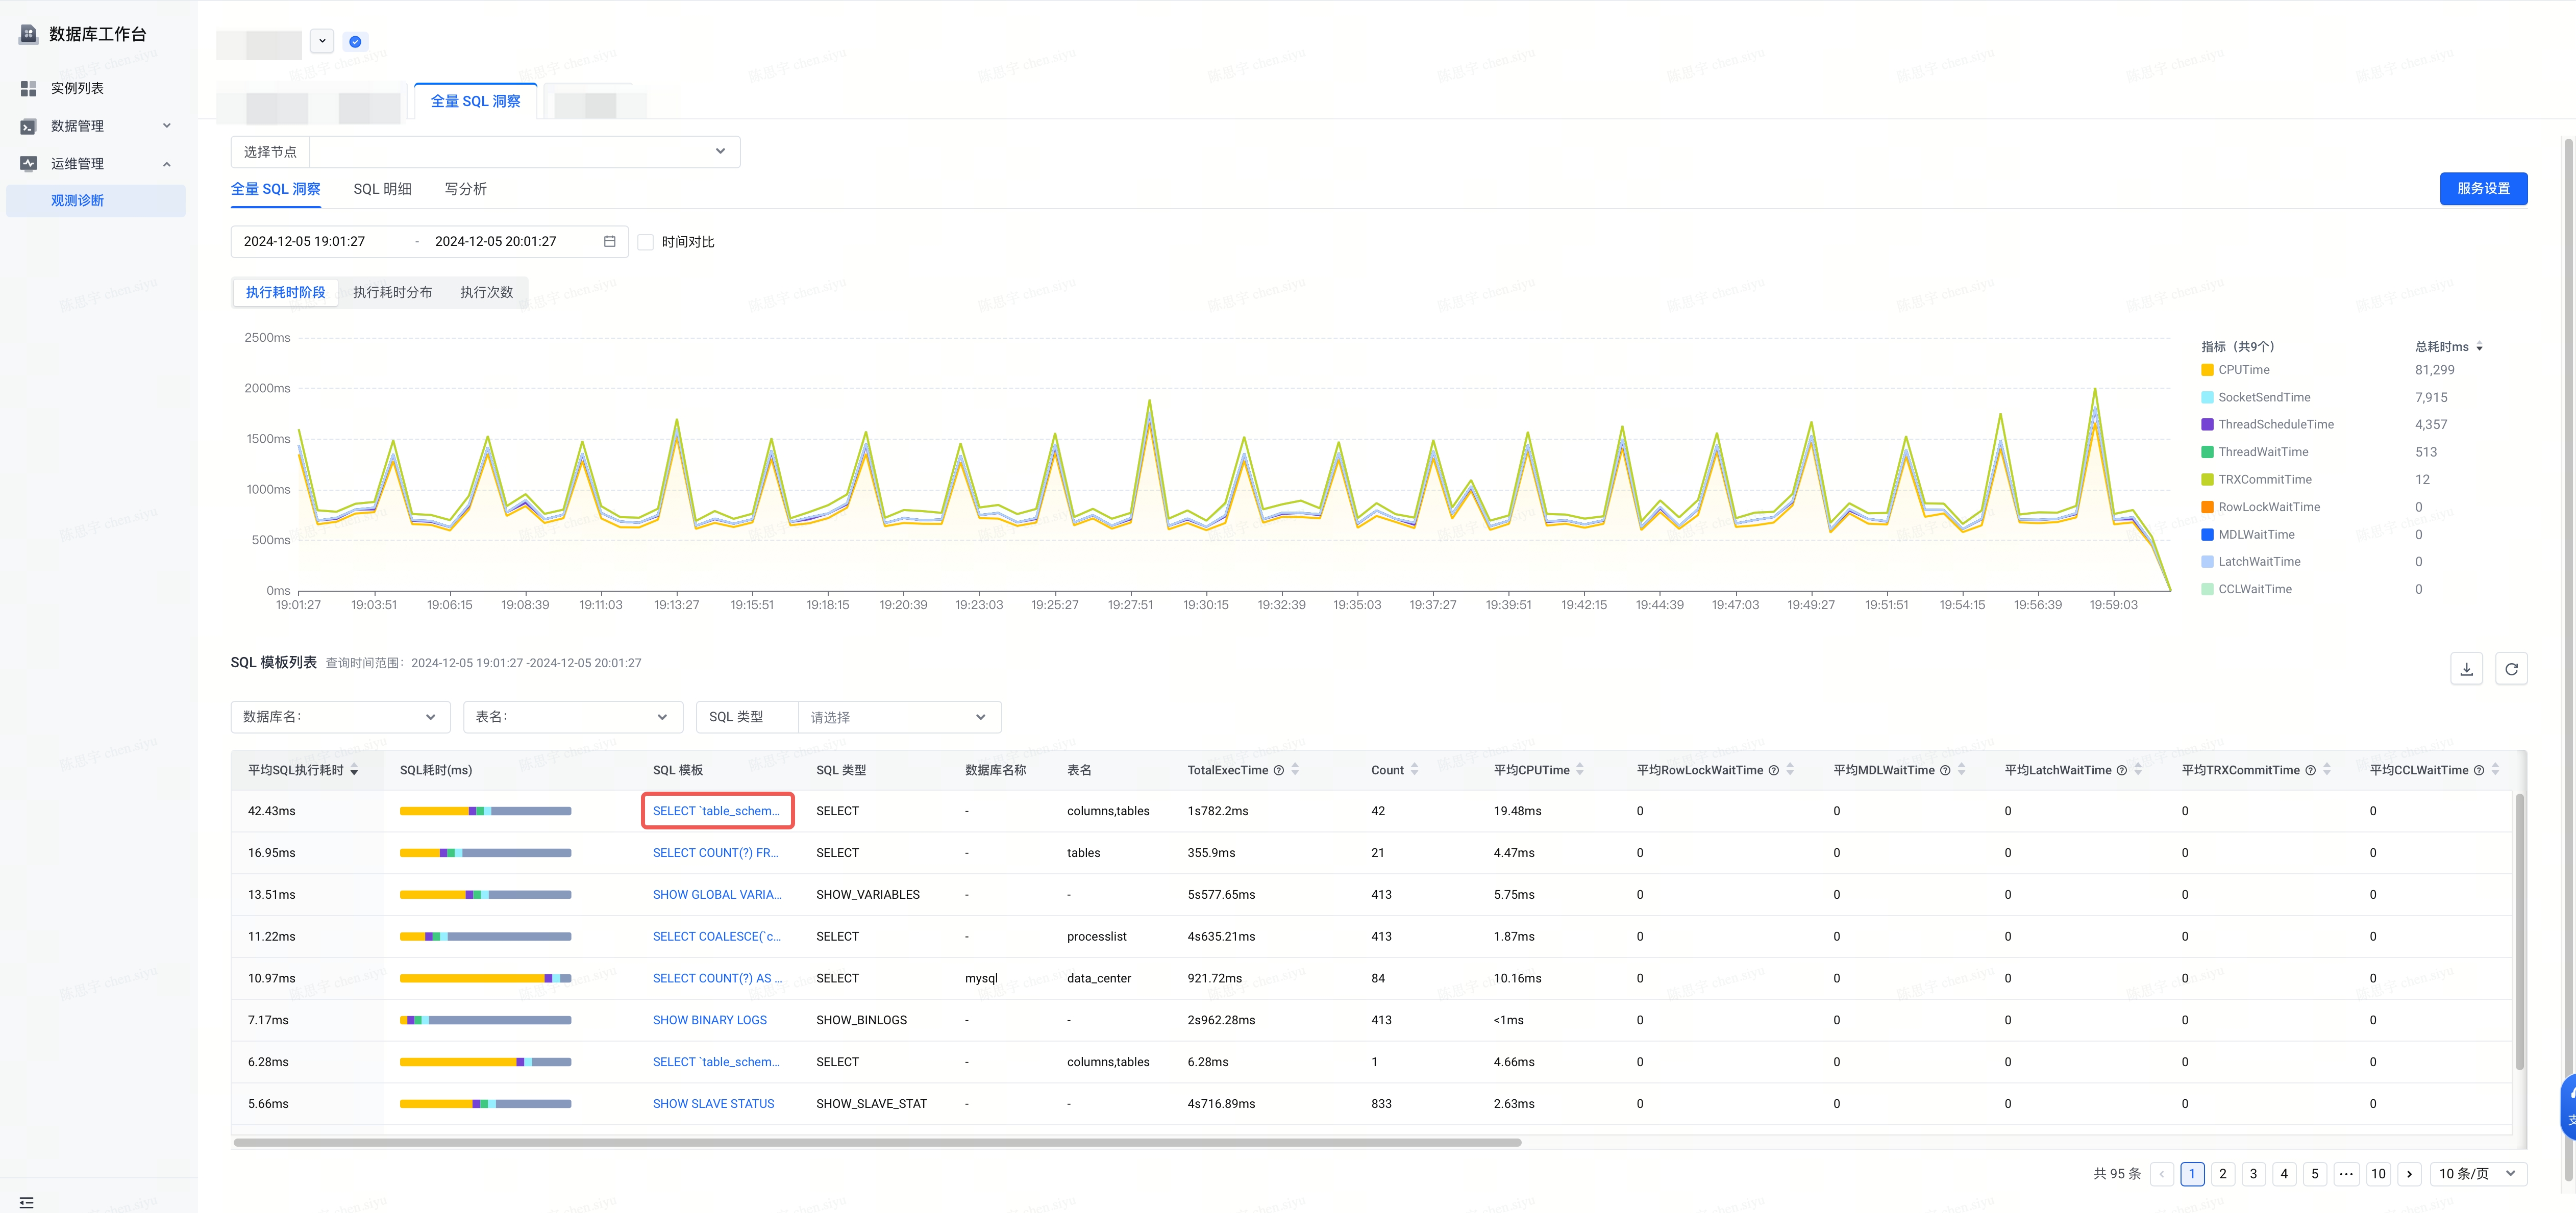
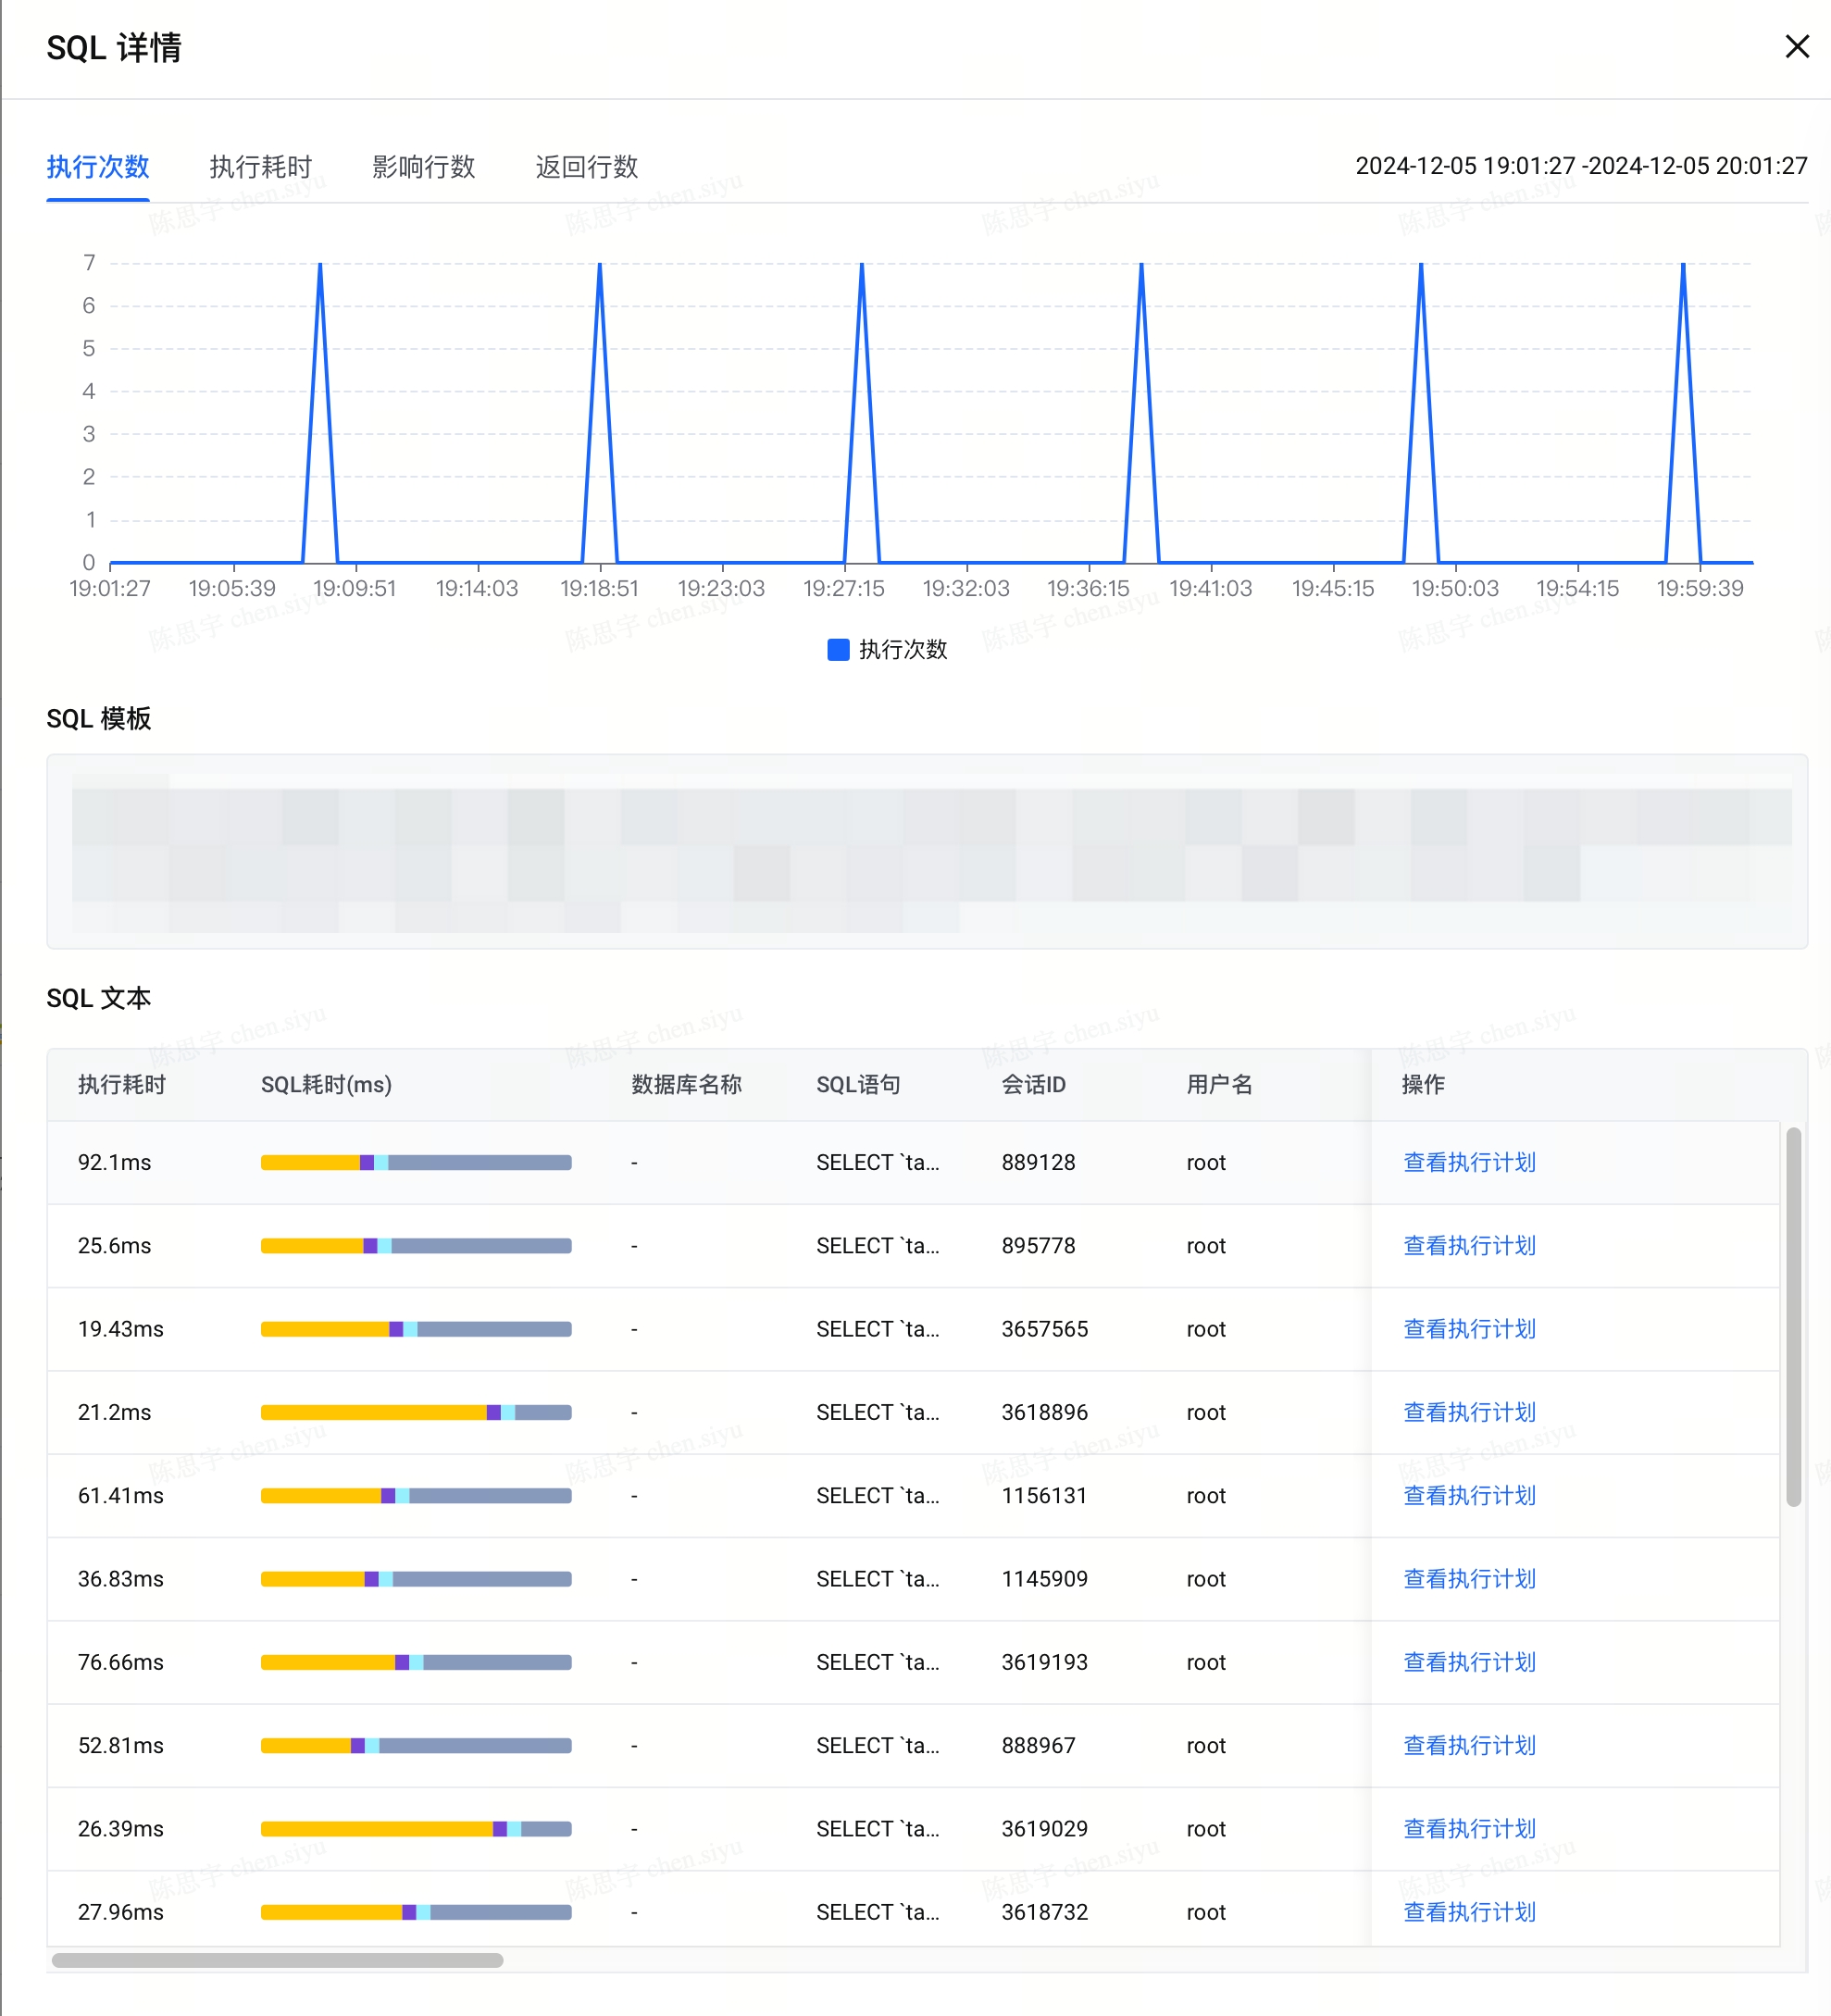
- Process SQL. After locating the SQL, it can be processed by SQL throttling or killing the session.
Increased connection count
Cause analysis
MySQL allocates memory for each connection, so an increased connection count also increases MySQL memory usage.
Path: log on to Database Workshop>Observation diagnosis>Performance monitoring>Current open connections. For more information, refer to View performance monitoring metrics.

Solution
Release idle connections.
SQL causes an increase in memory
1. Complex SQL
Cause analysis
The caches that consume more memory at the Server layer include thread caches like Thread Cache, BinLog Cache, Sort Buffer, Read Buffer, and Join Buffer. These caches are non-resident and are typically released when a connection is closed. A large number of complex SQL statements, such as those with join or order by clauses, may cause an increase in memory.
Solution
- Decrease sort_buffer_size, join_buffer_size, or binlog_cache_size (this may reduce query efficiency).
- Locate SQL: Run show processlist or use Slow log analysis in the Database Workshop. Then, use the `explain` statement to check for operations such as `JOIN` and `AGG`. The procedure is the same as above. The operation path for slow log analysis is: Log on to Database Workshop>Observation diagnosis>> Slow log analysis. For more details, refer to Slow log analysis.
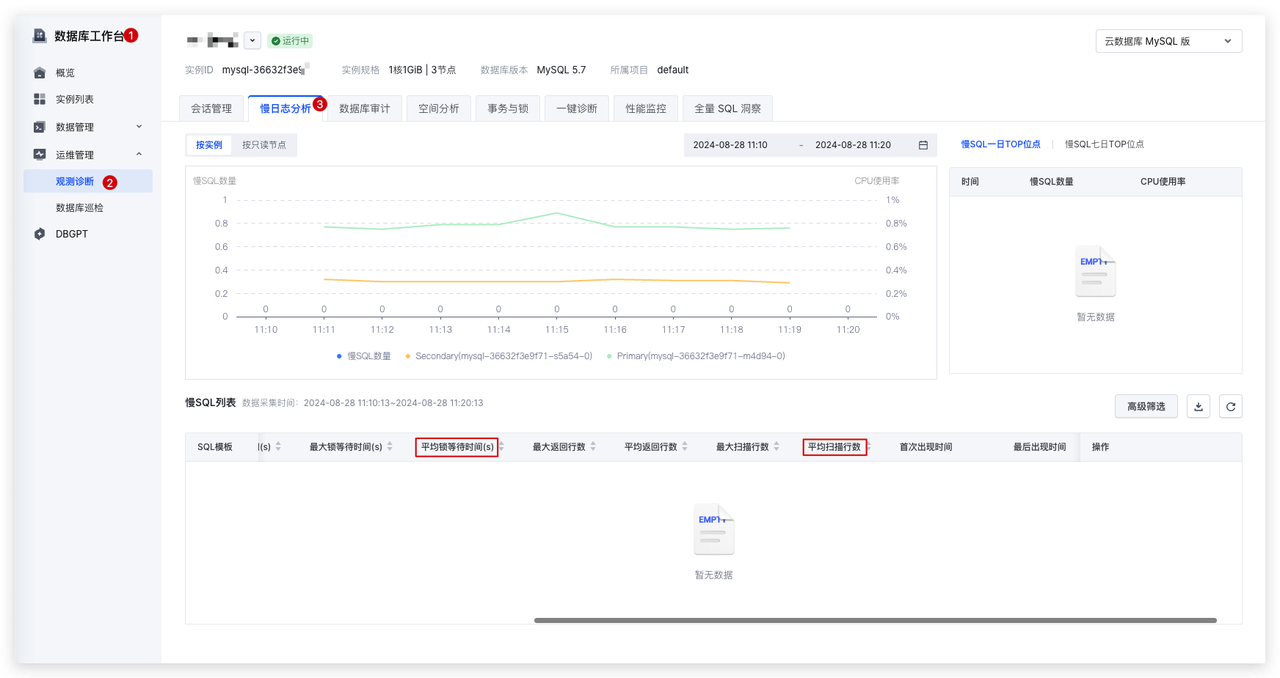
- Process SQL: After locating the SQL, it can be processed by SQL throttling or killing the session.
2. Temporary tables
Cause analysis
MySQL may use temporary tables when processing SQL. The size of in-memory temporary tables is limited by the tmp_table_size and max_heap_table_size parameters. When the limit is exceeded, they are converted to on-disk temporary tables. If a large number of connections create many temporary tables at once, it may cause a sudden increase in memory usage. MySQL 8.0 implements a new temptable engine. The total size of in-memory temporary tables allocated by all threads must be less than the `temptable_max_ram` parameter, which defaults to 1 GB. If this limit is exceeded, the tables are converted to on-disk temporary tables.
Solution
- Reduce `tmp_table_size` and `max_heap_table_size` (MySQL 5.7) or `temptable_max_ram` (MySQL 8.0).
- Locate SQL: execute show processlist or use Slow log analysis in Database Workshop, and then use `explain` to check whether temporary tables are used.
- Process SQL: after locating the SQL, it can be processed by SQL throttling or killing the session.
3. Multiple statements
Cause analysis
MySQL allows multiple SQL statements, separated by semicolons (;), to be sent in a single request. MySQL processes these statements sequentially, but some memory is not freed until all statements have been executed.
When sending multiple statements this way, if a very large batch of SQL is sent at once (e.g., hundreds of megabytes), the cumulative memory consumed by various object allocations during execution can be substantial, potentially causing the MySQL process to run out of memory. In addition to multiple statements, bulk inserts (a single insert statement for batch-inserting multiple records) and extremely long SQL statements generated by framework tools also allocate significant memory during the network protocol and SQL parser phases, and thus require close attention.
In typical scenarios, a large number of multiple statements or bulk inserts can cause a sudden surge in network traffic. You can determine if this is happening by monitoring network traffic.
Path: Log on to Database Workshop>Observation diagnosis>Performance monitoring>The average number of bytes received from all clients per second. For more details, refer to View performance monitoring metrics.

Solution
- Locate SQL: Run show processlist or use Slow log analysis in Database Workshop to check for suspicious SQL statements. The method is the same as described above.
- Avoid sending SQL as multiple statements in your business implementation. Split statements to reduce the data volume of a single execution.
- Reduce concurrency to avoid executing too many of the above statements concurrently.
4. Blob/text fields
Cause analysis
Querying or writing very large blob fields causes dynamic memory allocation. Some of this memory is not released until the table is closed, leading to increased memory usage.
Solution
- Locate SQL: Execute show processlist or use Slow log analysis in the Database Workshop to find suspicious SQL. The method is the same as above.
- Reduce concurrency to avoid executing too many of the above statements concurrently;
- Execute flush table table_name during off-peak hours to release the cache for the corresponding table.
5. Full-text index
Cause analysis
Full-text indexing uses a large amount of memory to process index data, so it needs special attention.
Solution
- Locate SQL: Check for suspicious SQL by executing show processlist or by using Slow log analysis in the Database Workshop. The method is the same as described above.
- Execute flush table table_name during off-peak hours to release the corresponding table's cache.
Large number of databases and tables
Cause analysis
In MySQL, each table has memory overhead. Besides the memory consumed by table objects in the InnoDB layer, the table cache in the server layer also consumes memory. A high number of tables in an instance or a high QPS can also increase memory usage.
Solution
- Check if the table_open_cache parameter was recently increased.
- On the Instances page, click the instance name of the target instance to enter the Instances page.
- Click the Parameter configuration tab.
- View MySQL parameter modification history.
-

- Confirm whether the number of databases and tables is continuously increasing. If so, upgrade the instance specification.
Stored procedure
Cause analysis
Calls to stored procedures, functions, triggers, or events consume additional memory and require special attention.
Use Database Workshop to view stored procedures and other objects created by the service. Log on to Database Workshop to view the instance's usage of stored procedures.

- If performance_schema is enabled, use the following SQL statement to view the memory usage of stored procedures
Solution
Log on to Database Workshop, check the number of triggers, stored procedures, functions, and events that the instance uses, and reduce their use.
Increased memory usage caused by performance_schema
Cause analysis
Although performance_schema can monitor MySQL memory usage, its maintenance also incurs additional memory overhead. Therefore, enabling performance_schema or loose_rds_performance_schema may increase memory usage. Using this feature may put significant pressure on the instance, especially for instances with low specifications. Therefore, continuously monitor the instance's memory usage after enabling this feature.
Execute SHOW ENGINE PERFORMANCE_SCHEMA STATUS to obtain the memory consumed by performance_schema, and focus on performance_schema.memory in the output.
Solution
- Close performance_schema or loose_rds_performance_schema.
- RDS for MySQL provides the modifiable parameter performance_schema_max_thread_instances, which sets the maximum number of observation threads (the maximum number of rows in the performance_schema.threads table) to control memory consumption by the performance_schema feature. The default value of this parameter is 1024 and can be adjusted based on the instance specification and business needs. For more information about modifying parameters, see Modifying parameters.
Upgrade instance specification
If memory usage continues to increase after troubleshooting, it may be a normal result of business pressure. Consider upgrading the instance specification through regular modification of specification or temporary upgrade to increase memory.
Common actions
SQL throttling
After locating the problem SQL, you can limit its execution frequency by using SQL throttling.
Procedure
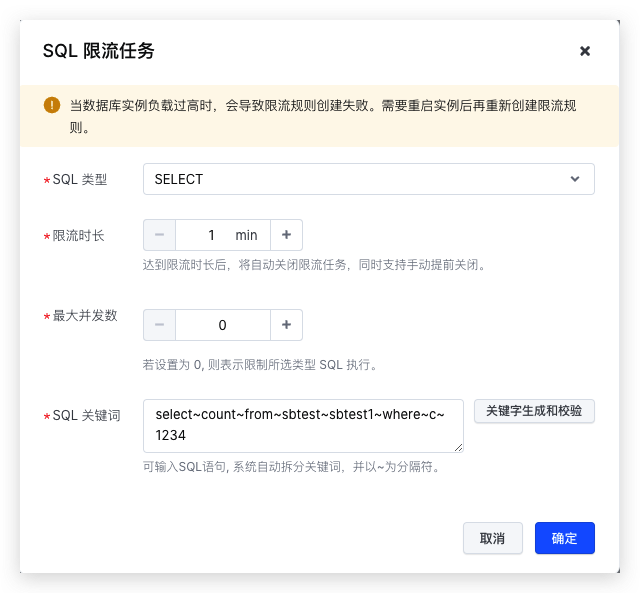
- Log on to Database Workshop>Observation diagnosis>Session management>SQL throttling>Enable the SQL throttling feature>Create a task.
-

- In the Create SQL throttling task window, enter the problem SQL and adjust the maximum concurrency (a value of 0 will completely block the SQL). Click Generate and validate keywords to split the keywords. The keywords are separated by a tilde (~).
- Click OK to submit the task.
Kill session
Procedure
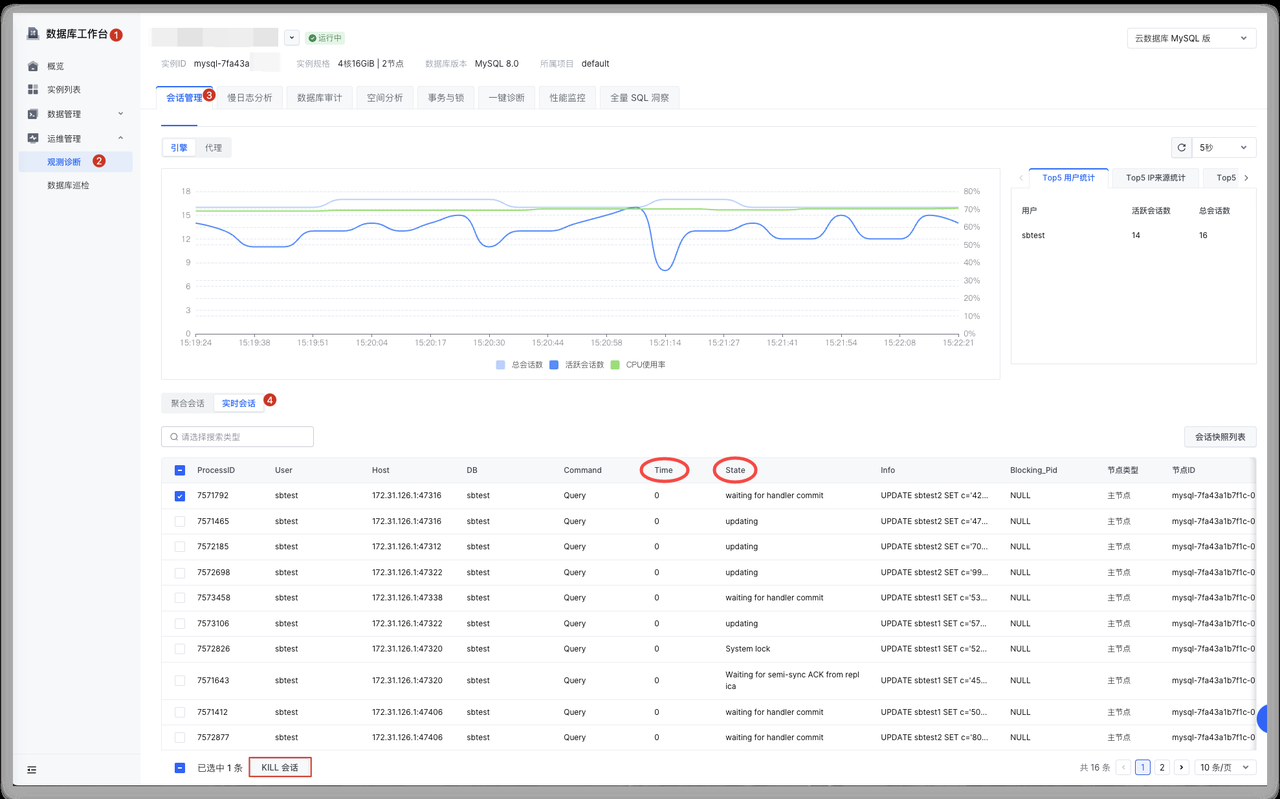
- Log on to Database Workshop>Observation diagnosis>Session management.
- In the Real-time sessions area, check the Time and State of the sessions.
-
Last updated: 2025.07.10 21:03:55
All rights reserved © Beijing Volcano Engine Technology Co., Ltd2024
