Billing Center
Billing Center


Document

- Documentation
 Billing CenterBill managementCost Analysis
 Copy page
 Download PDF
Bill management
Cost Analysis
Copy pageDownload PDFCost Analysis
Feature Overview
Cost Analysis provides self-service visualization capabilities for analyzing expense and cost bills. It supports multi-dimensional filtering and categorized summaries to view expense trends and structures. Users can save viewing conditions as report templates for quick access.
Note:
- Cost Analysis data is updated one day later than the bill details. Final data for the current month is available on the 4th of the following month. If there are bills with the billing mode set to "Contract Billing," the final data for the current month is available on the 5th working day of the following month. Cost bills are available one day later than the bill details.
- The expense trend chart only displays the top 10 categorized values. The remaining amounts are summarized as "Others," and all categorized details can be viewed in the expense details.
- When the bill type is "Bill," only cost data analysis from January 2022 onwards is supported. When the bill type is "Cost Bill," only cost data analysis from the month the cost bill was activated is supported.
Operation Guide
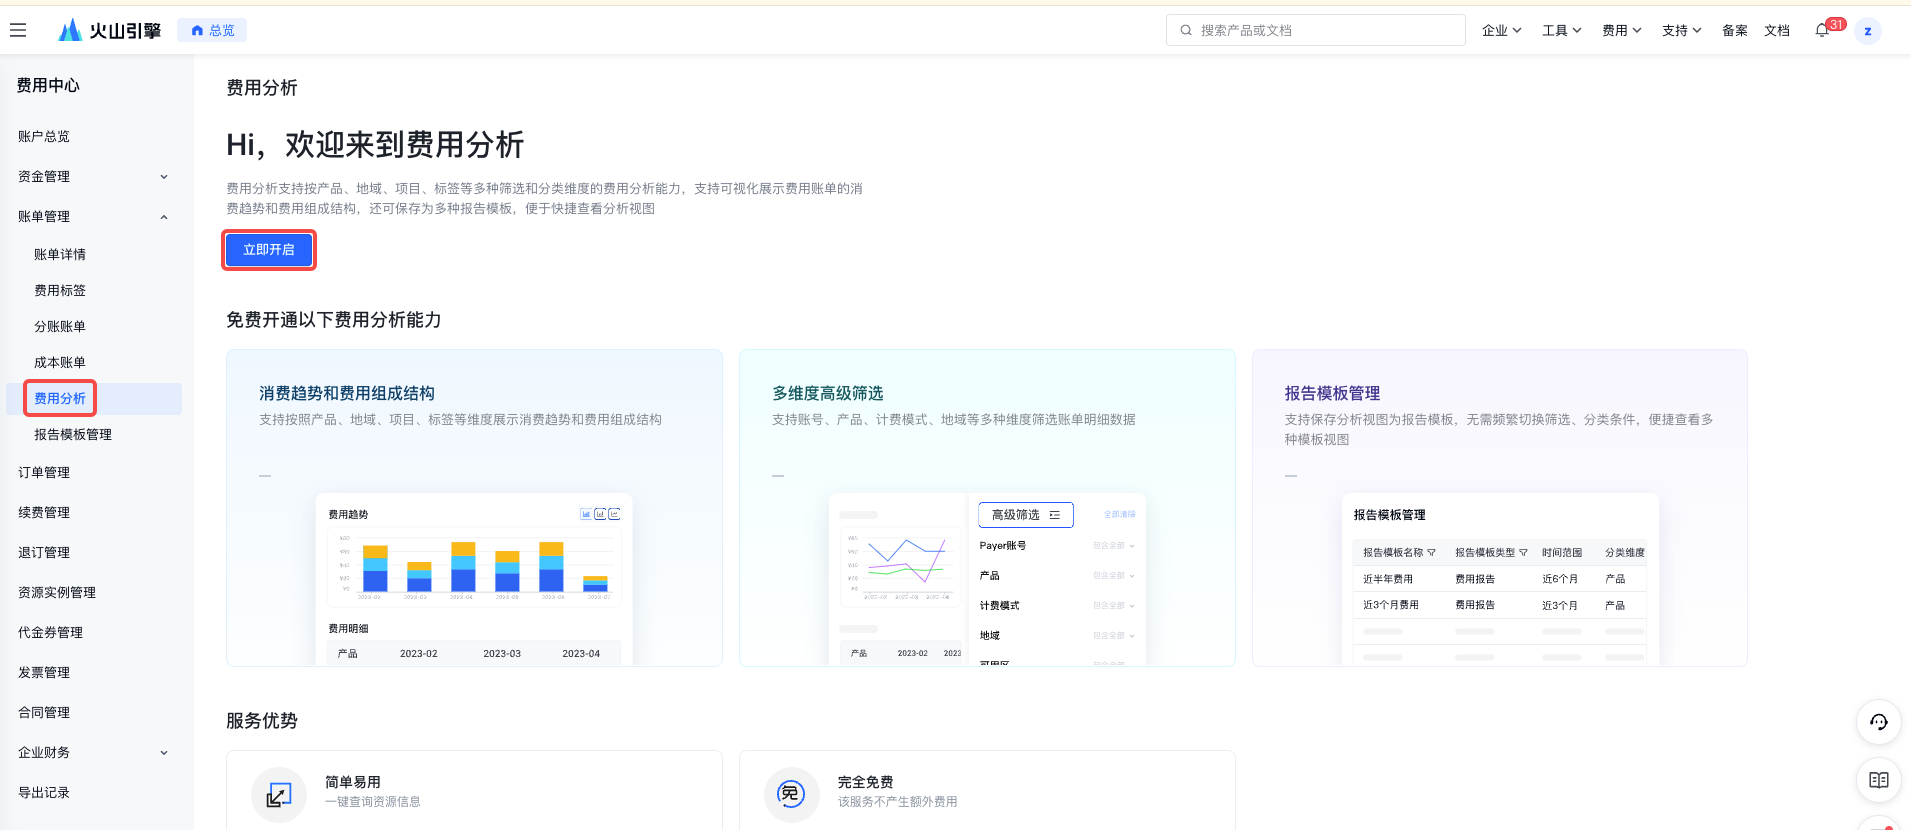
1. Activate the Cost Analysis Service:
Log in to the Volcano Engine Cost Center - Cost Analysis, and click to activate the Cost Analysis Service when entering for the first time.
2. View Cost Trends:
On the Cost Analysis page, you can filter and view cost trends under various classification dimensions and filter conditions. Supports three styles: bar chart, line chart, and stacked chart.
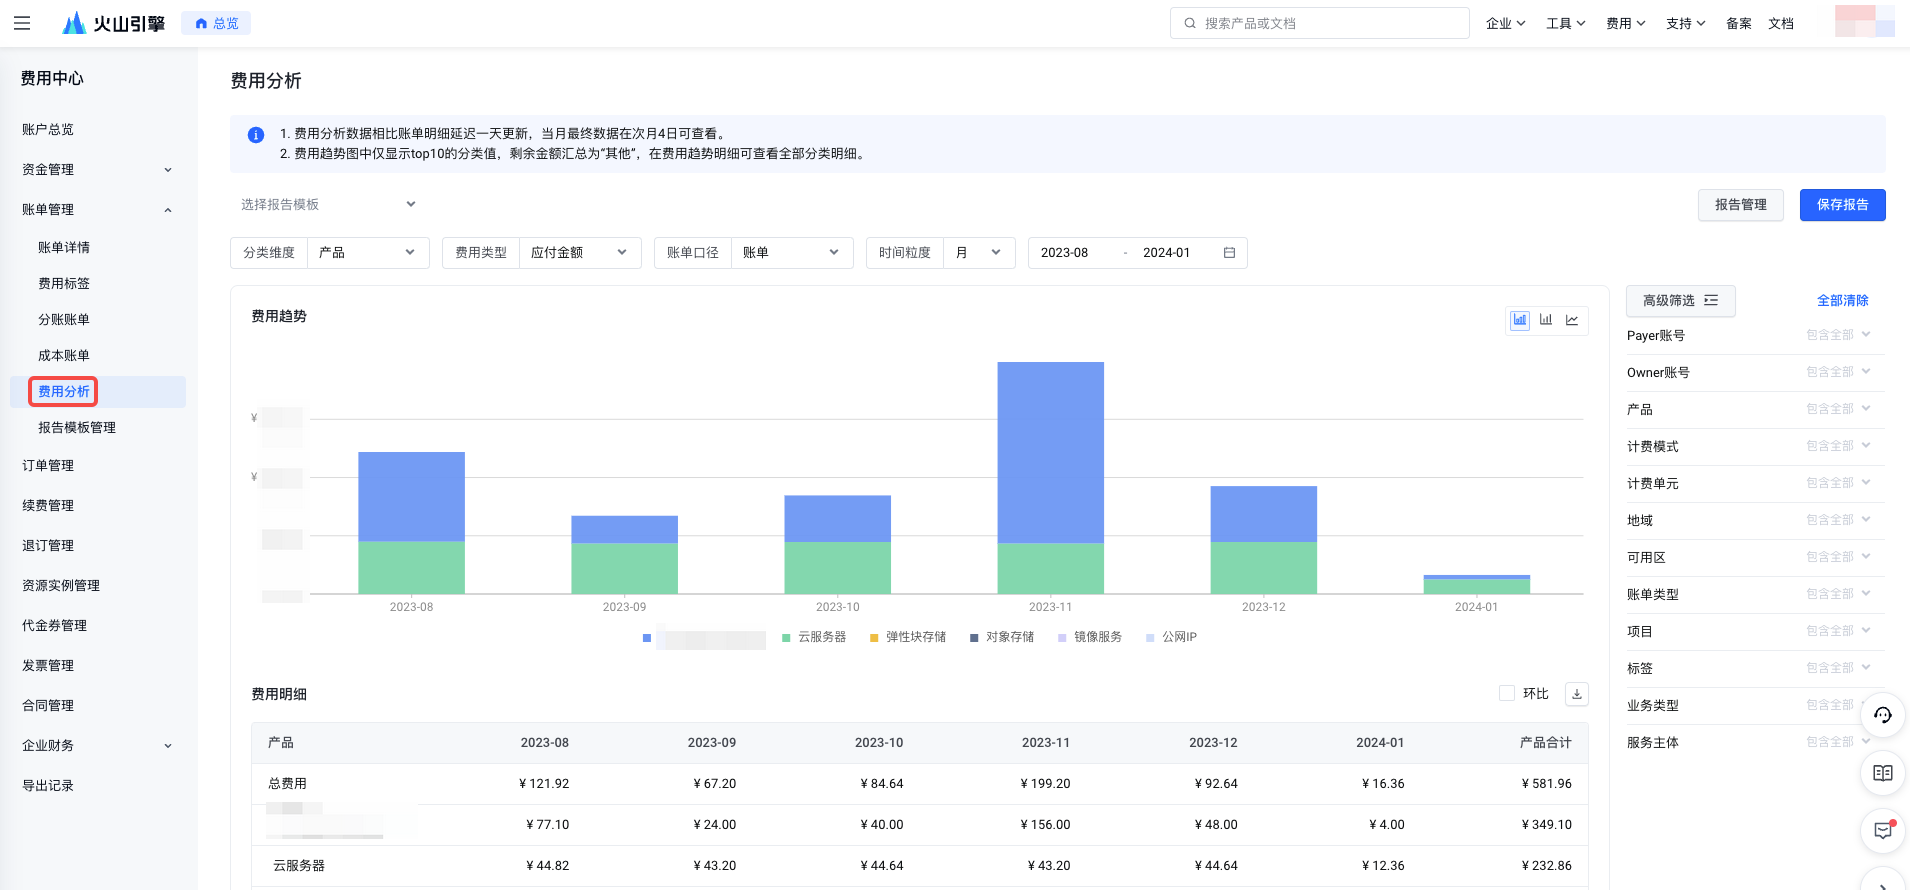
- Classification Dimensions: Supports viewing cost trends based on multiple dimensions such as product, region, project, and tags.
- When tags are used as a classification dimension, you need to specify the tag key to view the cost trend for the corresponding tag.
- When instance ID is used as a classification dimension, you can select up to 10 instance IDs to view cost trends; and you can view data for up to 31 days at a time.
- Bill Type: Supports cost analysis for two types of bills: regular bills and cost bills.
- Cost Type:
- When the billing caliber is invoice, it supports cost types such as original price, discounted price, payable amount, and cash payment.
- When the billing caliber is cost bill, it supports the allocated amount for the current period corresponding to the amount, such as allocated original price for the current period.
- Time granularity and range: Supports viewing data within a certain time range by month or by day.
- When viewing by month, it supports viewing data for up to 12 months.
- When viewing by day, it supports viewing data for up to 92 days. If viewing by instance ID dimension, it only supports viewing data for up to 31 days.
- When selecting future dates, if sufficient historical data exists, it will display forecast data for the corresponding dates.
- Filter conditions: Users can view more precise cost data by using advanced filters; the filter conditions default to include all, and when selected, it supports either include only or exclude only.
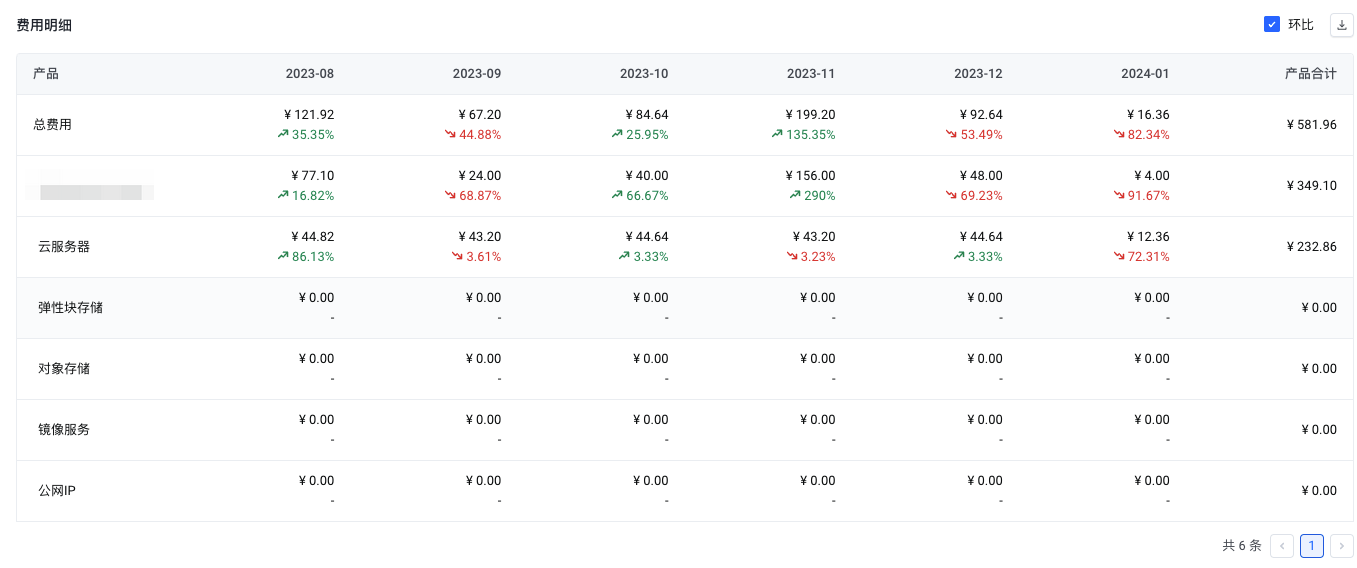
3. View cost details list:
The cost details list supports querying distribution details under each classification dimension. After checking the month-on-month comparison, it can display the month-on-month data compared to the previous period.
4. Prediction Rules and Application
Prediction analyzes historical billing data within a specific time range based on product, billing mode, commodity form, and billing method. It excludes special scenarios such as temporary upgrades or downgrades, refunds, and adjustments, using business rules and algorithms to forecast future cost fluctuations and amounts.
Volcano provides customers with an 80% prediction interval, meaning there is an 80% probability that the actual billing amount will fall within this range. The prediction interval is determined by the volatility of the customer's historical expenses. Stable spending helps reduce prediction deviations.
The prediction results may differ from your actual costs and are for reference only.
When selecting future dates, if the account has sufficient historical data (at least 30 days of billing history), the system will display predicted data for those future dates.
- When selecting by day, you can choose up to 90 future days.
- When selecting by month, you can choose up to 12 future months.
During prediction, only total cost dimension prediction and account filtering are supported; other classification dimensions and filters are not supported.
Prediction does not include cost changes that may arise from future scenarios such as upgrades, unsubscriptions, adjustments, or the creation or unbinding of financial hosting/management relationships.
Frequent changes, cancellations, and adjustments to renewals may affect the accuracy of predictions. The results are for reference only.
Predicted data is estimated based on historical data. If product prices, customer discount conditions, etc., change, the predicted data may differ from actual costs. The results are for reference only.
5. Report Template Management:
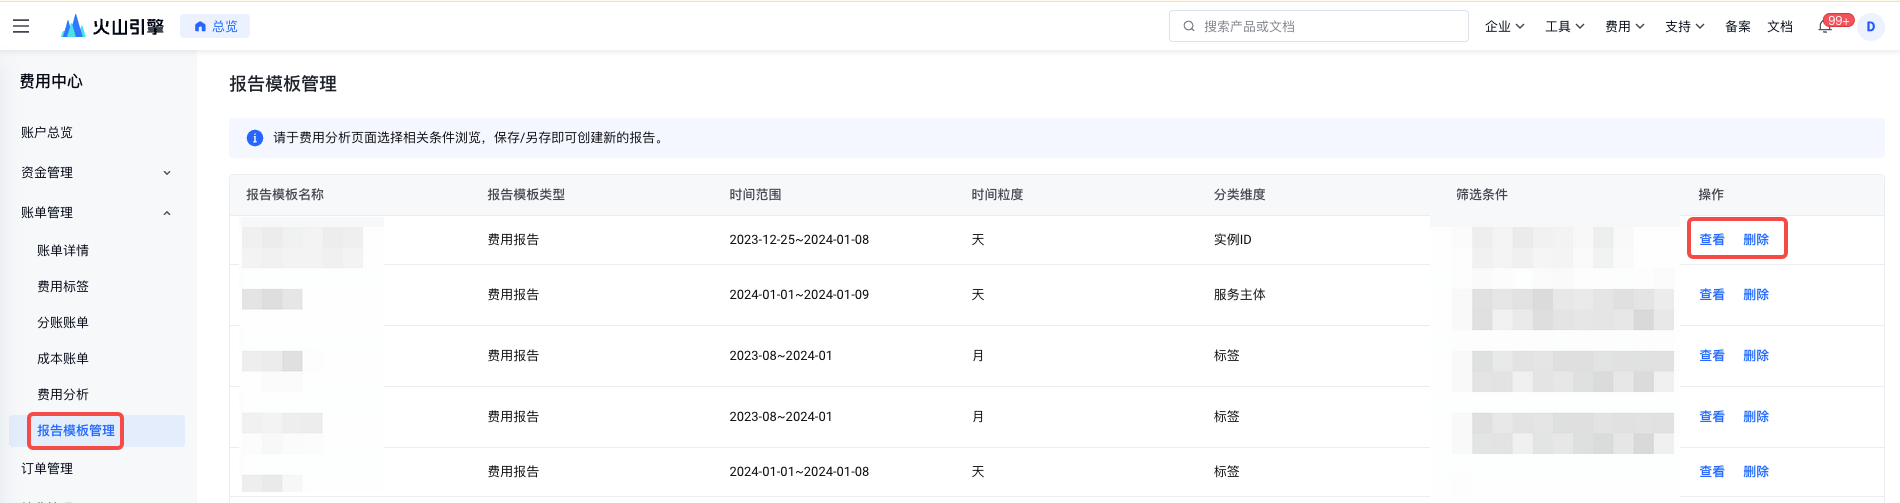
Click "Save Report" or "Save As" in the upper right corner to save the current page's viewing conditions as a report template. Click "Report Management" to navigate to the report template management menu, where you can view and manage report template data.
- View Report: Click "View" to quickly access the cost analysis view under the conditions of the selected report template.
- Delete Report: Click "Delete" to remove the report template. (Note: System-preset report templates cannot be deleted or modified.)
Last updated: 2025.08.05 20:15:11
All rights reserved © Beijing Volcano Engine Technology Co., Ltd2024
