You need to enable JavaScript to run this app.
Load Balancer

Load Balancer

Copy page
Download PDF
Best Practices
Viewing an NLB flow log
Copy page
Download PDF
Viewing an NLB flow log
Scenarios​
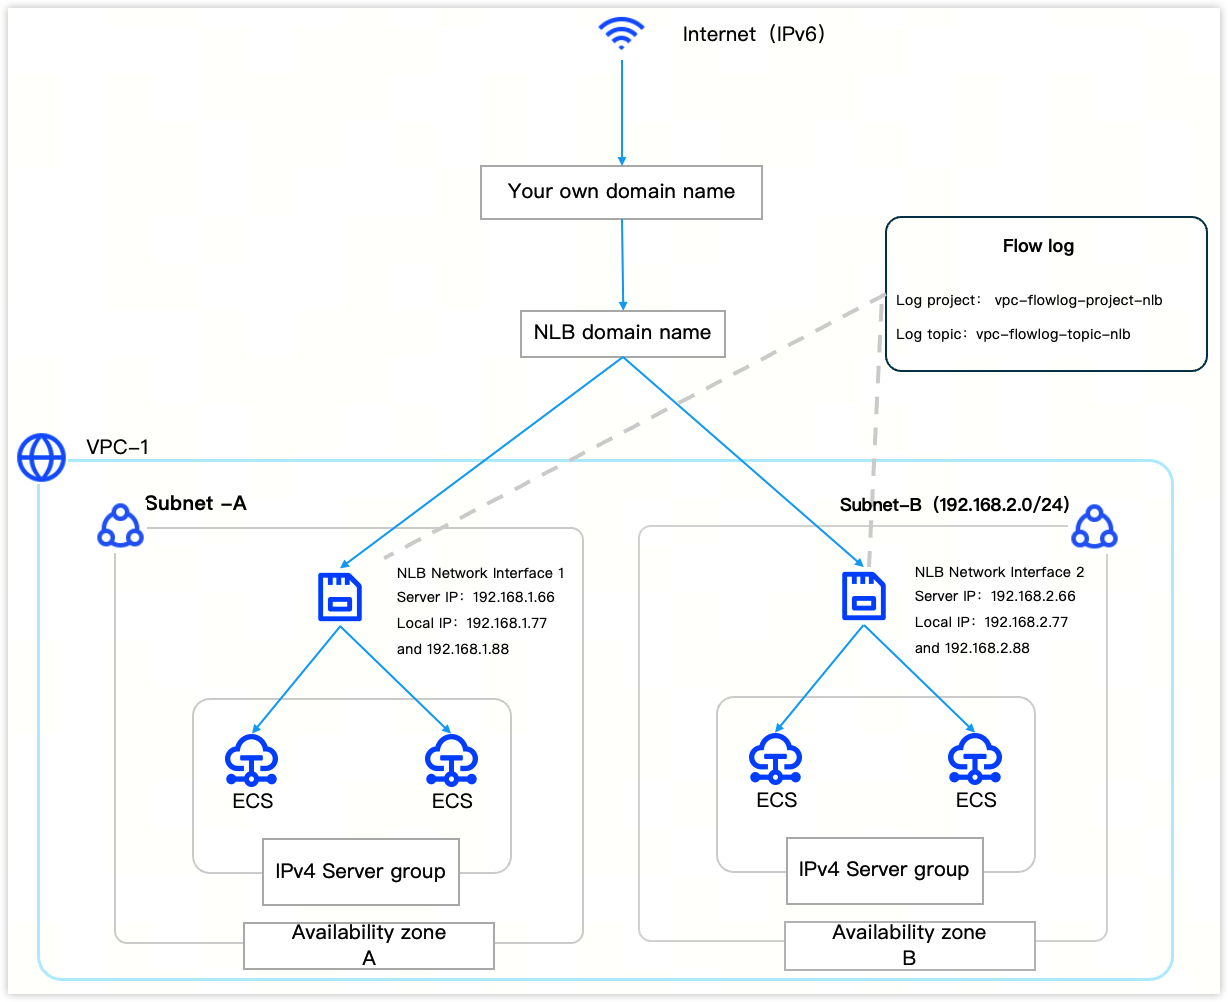
You can use flow logs to monitor the traffic distribution and forwarding efficiency of your Network Load Balancer (NLB), ensuring business stability.​
​​​
Data planning​
​
Resource Type​
Resource name​
CIDR block/IP address​
Remark​
Virtual Private Cloud (VPC)​
VPC-1​
192.168.0.0/16​
--​
Subnet​
Subnet-1​
192.168.1.0/24​
Availability zone A​
​
Subnet-2​
192.168.2.0/24​
Availability Zone B​
Elastic Compute Service​
ECS-1​
192.168.1.2​
--​
​
ECS-2​
192.168.1.3​
--​
​
ECS-3​
192.168.1.4​
--​
NLB​
NLB-X​
  • ENI 1: (AZ-A)​
  • Service IP: 192.168.1.66​
  • Local IP: 192.168.1.77 and 192.168.1.88​
  • ENI 2: (AZ-B)​
  • Service IP: 192.168.2.66​
  • Local IP: 192.168.2.77 and 192.168.2.88​
  • The Service IP is used for communication between clients and the NLB instance​
  • The Local IP is used for communication between the NLB instance and backend servers​
Log project​
vpc-flowlog-project-nlb​
--​
--​
Log topic​
vpc-flowlog-topic-nlb​
--​
Traffic for both Service IP and Local IP is collected​
​
Preparations​
  • When using the Flow Logs service for the first time, please follow the on-screen instructions to complete the authorization.​
tip​
The following section only covers essential parameters and their recommended values. For all parameters not explicitly discussed, retain the default settings unless otherwise required by your specific use case.​
Step 1: Create Flow Log​
This NLB instance contains two ENIs. Therefore, you need to create two Flow Logs instances of the ENI type, and both instances will share the same Log Project and Log Topic. You can refer to the following steps to create the two Flow Logs instances sequentially.​
  1. Log in to the VPC console.​
  1. In the left-side navigation pane, select Flow Log.​
  1. In the top menu bar, select the target project and region.​
  1. Click Create Flow Log.​
  1. Configure relevant parameters based on the table below.​
  • ​
    Parameter​
    Explanation​
    Value (1)​
    Value (2)​
    Billing method​
    Currently only support Pay-as-you-go.​
    Pay-as-you-go​
    Pay-as-you-go​
    Name​
    Enter the name of flow log.​
    NLB-flowlog-1​
    NLB-flowlog-2​
    Resource Type​
    Select the resource type for flow log recording, which defines the scope of flow log collection. Please select network interface type.​
    Network interface​
    Network interface​
    Resource​
    Select NLB ENI from dropdown list.​
    NLB ENI 1​
    NLB ENI 2​
    Traffic type​
    Select the traffic type, i.e., the type of traffic to be recorded in the flow logs.​
    • All Traffic: Collects all inbound and outbound traffic of the Network Interface.​
    • Permitted Traffic: Collects traffic allowed by security groups and network ACLs.​
    • Rejected Traffic: Collects traffic rejected by security groups and network ACLs.​
    Total traffic​
    Total traffic​
    Sampling interval​
    Select the sampling interval for the flow log. The sampling interval is the time interval at which the VPC delivers flow log data to the Torch Log Service (TLS). For connections with continuous data packets, sampling interval also represents the maximum aggregation time for traffic data to be aggregated into a single log entry.​
    • 10 minutes: The flow log samples every 10 minutes, storing the traffic data within these 10 minutes to the Torch Log Service.​
    • 5 minutes: The flow log samples every 5 minutes, storing the traffic data within these 5 minutes to the Torch Log Service.​
    • 1 minute: The flow log samples every 1 minute, storing the traffic data within this 1 minute to the Torch Log Service.​
    10 minutes​
    10 minutes​
    Log project​
    Select a Log Project. A Log Project is the fundamental resource management unit in the TLS, used for tenant resource isolation and access control.​
    • Create a Log Project: Create a new log project by entering a name for it.​
    New log project​
    vpc-flowlog-project-nlb​
    Existing log projects​
    vpc-flowlog-project-nlb​
    Log topic​
    Select a Log Topic for the logs. A Log Topic is the fundamental unit in Log Service for log management (e.g., collection, storage, query, and analysis).​
    • Create New Log Topic: Create a new log topic. And automatically Enable automatic sharding. This Log Topic is managed by VPC Flow Logs. It can only be modified or deleted after the associated VPC Flow Logs are deleted.​
    • Use Existing: Select an existing log topic. If the existing log topic does not have automatically split log partitions enabled, exceeding the capacity of existing partitions may lead to data loss. Therefore, it is recommended to enable Automatic sharding. For procedures, see Automatic split shards.​
    New log topic​
    vpc-flowlog-topic-nlb​
    Existing log topic​
    vpc-flowlog-topic-nlb​
    Enable index​
    Select Enable Indexing Indexes are used for searching and analyzing data. Flow Logs must be configured with indexes before you can perform search and analysis.​
    • Once checked, the system will automatically configure a key-value index within the log topic based on the flow log fields.​
    • If not selected, you must configure indexes for the flow logs in the log topic and enable field analytics Before analyzing the flow logs. For detailed actions, see Configuring index.​
    Check​
    Check​
    ​
  1. Follow the console guidance to review and accept Legal.​
  1. Click Buy now to complete creation.​
Step 2: Analyze flow log​
NLB Flow Logs collect traffic both between clients and the NLB instance and between the NLB instance and backend servers. Please filter and analyze the data as needed.​
  1. Click the Topic Name under the Log topic column for the target NLB Flow Logs.​
  1. Click the Search & Analyze icon on the right side of the target Log Topic.​
  1. To analyze the number of requests received by backend servers as an example, enter the following SQL query and analysis statement.​
  • ​
    dstport:80 | SELECT COUNT(*) as PV,dstaddr WHERE dstaddr NOT IN('192.168.1.66', '192.168.1.77', '192.168.1.88', '192.168.2.66','192.168.2.77','192.168.2.88') GROUP BY dstaddr​
    ​
When entering an analysis statement, replace the instance values according to the following rules:​
  • Replace the port 80 in dstport:80 with the actual port in use.​
  • Replace the NLB addresses (including Service IP and Local IP: 192.168.1.66, 192.168.1.77, 192.168.1.88, 192.168.2.66, 192.168.2.77, 192.168.2.88) with your actual NLB addresses.​
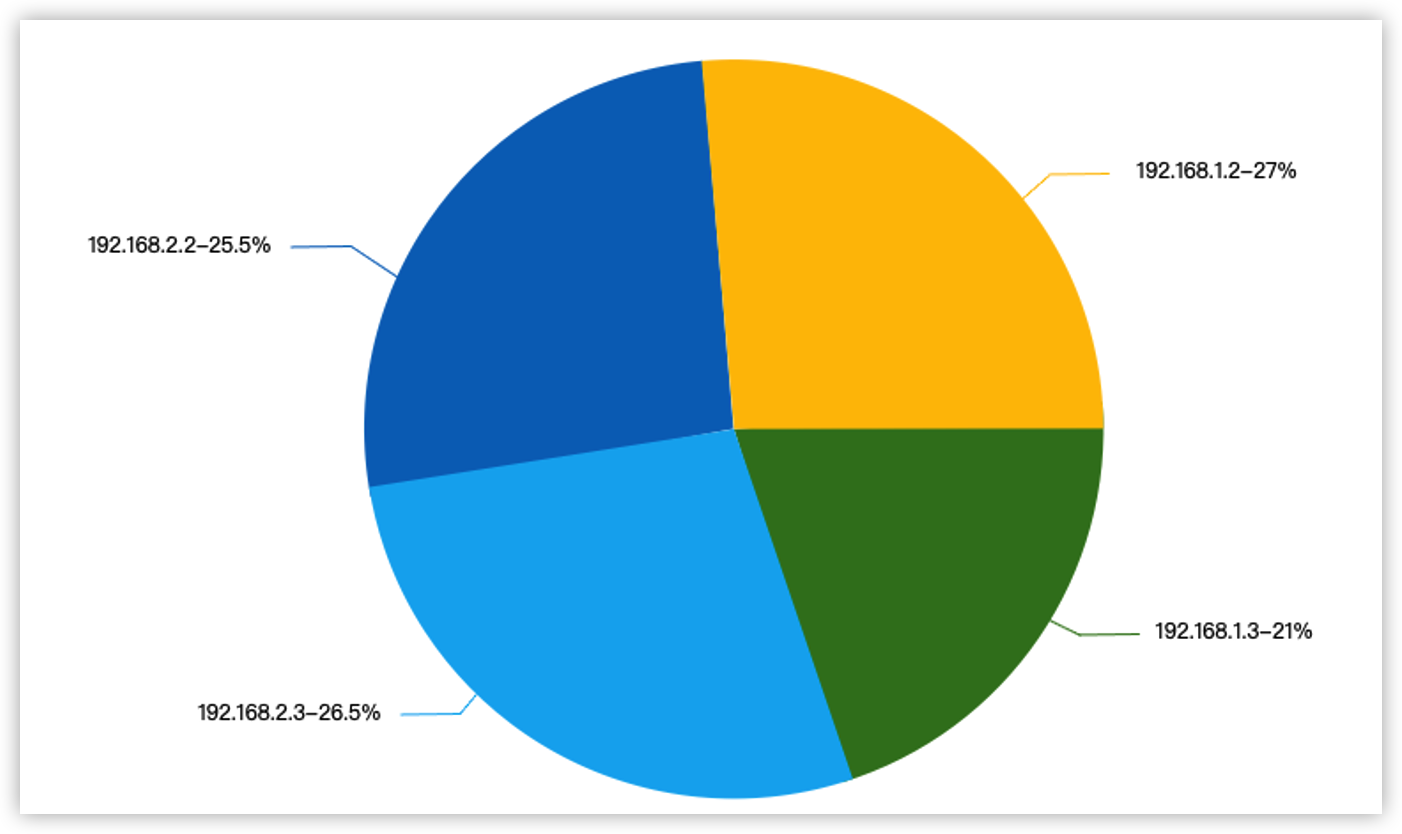
  1. View the analysis results.​
  • ​​​
  • As shown in the figure above, you can see the number of requests served by different backend servers of the NLB, as well as the percentage of total requests handled by each backend server.​
​
​
Last updated: 2026.06.23 19:07:19