Torch Log Service
Torch Log Service
Torch Log Service


Document
Product News
Product Overview
Product Billing
User Guide
TLS Agent
AgentLoop
Resource management
Host group
Data collection
LogCollector collection
Introduction to LogCollector
Installation and upgrade
Collect host logs
Collect container logs
LogCollector plugins
Manage LogCollector
general reference
Data import
Cloud product log collection
TOS log collection
DBW log collection
VPN Log collection
VKE log collection
CLB log collection
CloudTrail log collection
CFW log collection
NTA log collection
ALB log collection
APMPlus log collection
veFaaS log collection
VPC log collection
veImageX log collection
TrafficRoute DNS log collection
DDoS log collection
WAF log collection
DCDN log collection
Multi-cloud security platform log collection
APIG log collection
Machine learning task log collection
CR log collection
Volcano Ark application lab log collection
FileNAS log collection
LLM Application Firewall Service log collection
vePFS log collection
Cloud security center log collection
EFS log collection
Data storage
Query and analysis
Configure log indexes
Query log
Analyze logs
Query and analyze logs using third-party tools
Associate external data source for log query
SQL function
SQL syntax
Visualization
Query and analysis charts
Summaries of query and analysis charts
Create dashboard
Use dashboard
Add dashboard filters and variables
Use other systems to analyze logs
Log application
Log applications for product observability
Log applications for large models observability
Coding Agent log app
ModelProvider log app
No-coding Agent log app
Log applications for basic service monitoring
Data processing
Data transformation
Syntax and functions
Global operation function
expression function
Data processing best practices
general reference
Data write processor
Data consumer processor
Data consumption and shipping
Ship logs to TOS
Ship logs to Kafka
Ship logs to Splunk
Alarm
Alarm policy
Alarm notification content
Alarm notification content template
alarm notification channel
Tracing service
Monitor Log Service
API reference
Project management API
Topic management API
Shard management API
Index management API
Log management API
Host group management API
Collection configuration management API
Data import API
Data processor API
Data transformation API
Data backflow API
SQL analysis API
Alarm management API
Consumer group management API
Kafka protocol consumption API
Tag management API
Trace storage API
Account management API
SDK reference
Go SDK
Java SDK
Python SDK
iOS SDK
C++ SDK
CLI reference
Best practices
Data collection
Query and analysis
permission management
Consumption and delivery
Visualization
Alarm
FAQs
Billing and cost FAQ
Data collection FAQ
Data storage FAQ
Index configuration FAQ
Query and analysis FAQ
Scheduled SQL tasks FAQ
Alarm FAQ
- Documentation
 Torch Log ServiceUser GuideVisualizationCreate dashboardCreate a blank dashboard
 Copy page
 Download PDF
Create dashboard
Create a blank dashboard
Copy pageDownload PDFCreate a blank dashboard
A dashboard is one of the visualization features provided by the Log Service, consisting of a collection of log data analysis and monitoring charts. You can view multiple query and analysis charts under the same project in the dashboard. This document describes the steps to create a blank dashboard.
tip
This document uses creating a dashboard directly from the dashboard list page as an example. You can also save query and analysis results as a new dashboard after performing a query and analysis. For detailed steps, refer to add charts to the dashboard.
Prerequisites
- The project and log topic have been created, and log data has been successfully ingested.
- Indexes have been configured. For detailed steps, refer to configure indexes.
Notes
- A project supports creating 50 dashboards.
- A dashboard supports adding 50 statistical charts.
Create a blank dashboard
- Log in to the Torch Log Service console.
- On the top navigation bar, select the region where the log service is located.
- In the left navigation bar, select Common Features > dashboard.
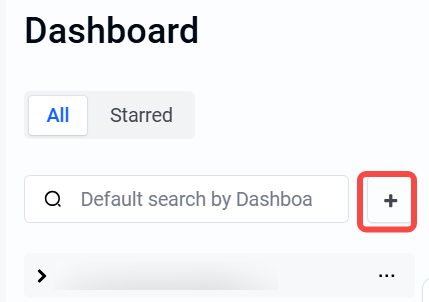
- Click in the dashboard list +。
-
- Click Create a blank dashboard, then click Next: Configure dashboard.
- Configure the dashboard details, then click Finish: Create dashboard.
- ConfigurationDescriptionDashboard nameSet the dashboard name.DescriptionEnter a brief description of the dashboard.ProjectSelect the project to which the dashboard belongs.
Next steps
Last updated: 2025.10.13 18:07:34
All rights reserved © Beijing Volcano Engine Technology Co., Ltd2024
