Database Workshop
Database Workshop


Document

- Documentation
 Database WorkshopUser guide (RDS for MySQL)Operation and maintenance managementObservation and diagnosisLog managementSlow log details management
 Copy page
 Download PDF
Log management
Slow log details management
Copy pageDownload PDFSlow log details management
This topic describes how to view the analysis results of slow logs and download target slow logs on the Database Workshop (DBW) console.
Prerequisites
- An instance and account for RDS for MySQL have been created. For detailed steps, refer to Creating an instance and Creating an account.
- If the target instance has security control enabled, you need to apply for operation and maintenance read-only or read/write permissions for the current account. For more information, refer to Enabling instance security control (RDS for MySQL), and Applying for operation permissions (RDS for MySQL).
Precautions
- When you access the Slow log analysis tab through Operation observability on the left navigation bar, slow log information about the first instance in the Instance list is viewed by default.
- Default displays slow log information from the past 10 minutes, such as the number of slow SQL, CPU usage, and Slow SQL list.
- You can view slow log data for up to the past 30 days, with a maximum query time span of 7 days.
- The database proxy is enabled by default for the RDS for MySQL instance. Therefore, the connection pool may be reused, that is, one connection is shared by multiple clients, which may cause the IP source to be inconsistent with the actual IP address and port.
- When filtering to view slow SQL queries within a certain period, the query end time must be later than the start time.
- When you filter by time to view the number of slow SQL queries and CPU usage of an instance or read-only node within a specified time, the slow SQL list pane displays the database, execution user, IP source, average execution time(s), maximum lock wait time(s), average rows returned, and first wait time for each SQL template within the specified time.
- Index optimization suggestions:
- The index optimization suggestion function needs to sample and analyze the content of the database and table. Therefore, when you view the index optimization suggestion of SQL for the first time, you need to authorize DBW to read the database and table.
- It takes about 10 to 20 seconds to view SQL index optimization suggestions.
- Index optimization suggestions are based on sampling analysis of partial data in the table. The generated optimization suggestions are for reference only and need to be further evaluated based on the actual situation.
- When downloading slow logs, note the following:
- Up to 1 million slow log entries can be downloaded in a single request.
- Slow log download tasks are retained for 1 day by default. Expired tasks will be automatically deleted.
- When you select to download slow log details, you will get the slow SQL that can be executed directly.
- You can view and export slow log download files in Export history.
- Slow log files downloaded from the system are compressed in .gz (Gzip) format. For macOS users, please extract the downloaded file using the steps below:
- Decompress using the built-in gzip or gunzip command-line tools:Open the Terminal and run the gzip or gunzip commands provided by the system to extract the files. The command format is gzip -d your_filename.gz or gunzip your_filename.gz.
- To decompress the file using the tar tool: Download and install the tar tool to decompress the file. The command format is tar -xz --force-local -f file_name.gz.
Query a slow log
- Log on to the DBW console.
- On the left navigation bar, select Operation and maintenance management > Observation and diagnosis.
- On the top menu bar, select the region.
- On the Observation and diagnosis page, click Log management.
tip
- You can also switch to the target instance by searching for the instance ID.
- When you access the slow log analysis through Observation and diagnosis on the left navigation bar, information about the first instance in the Instance list is displayed by default.
- On the Slow log tab, filter by the desired time frame and select the target node (such as the primary or secondary node) from the Node ID dropdown to view its slow log trend, statistical summary, and details, as shown below.
tip
- If no Node ID is selected, the slow log information for all nodes is displayed by default.
- In the Node ID dropdown, each node shows the number of slow logs within the selected time frame:
- 0 article: Indicates no slow logs during this period, with normal system response, and performance bottlenecks can be ruled out.
- Greater than 0 article: Indicates potential performance issues. It is recommended to further analyze the specific slow SQL.
- When selecting a time range, the query end time must be later than the start time.
- View slow log trends: In the left area of the Slow log details tab, you can view the slow log trends within a certain period. You can also click a specific time point to view the Slow SQL number and CPU usage at that moment.
- View slow log statistics: On the right side of the Slow log tab, you can view the Top 1-day slow SQL locations and Top 7-day slow SQL locations for a certain period.
- View slow log details: In the Slow SQL List section, filter slow SQL templates as needed and view detailed information of slow SQL within the templates. Specific parameters are shown in the table below.
tip
Before viewing slow SQL details on the slow SQL list pane, you need to click the bar graph of a certain point in time in the slow log development trend graph.
-
Download a slow log
tip
- Up to 1 million slow log entries can be downloaded in a single request.
- Slow log download tasks are retained for 1 day by default. Expired tasks will be automatically deleted.
- View and export the download file of slow log in the export history.
- Log on to the DBW console.
- On the top menu bar, switch the region.
- On the left navigation bar, select Operation and maintenance management > Observation and diagnosis.
- On the upper-left corner of the Observation and diagnosis page, click the icon to the right of the Instance name.
 icon, and select the target instance.
- On the target instance page, click Log management.
- On the Slow log details tab, select a node ID and a timeframe as needed.
- In the Slow SQL list area, filter the target slow logs as needed, and then click the
 icon.
icon.
-
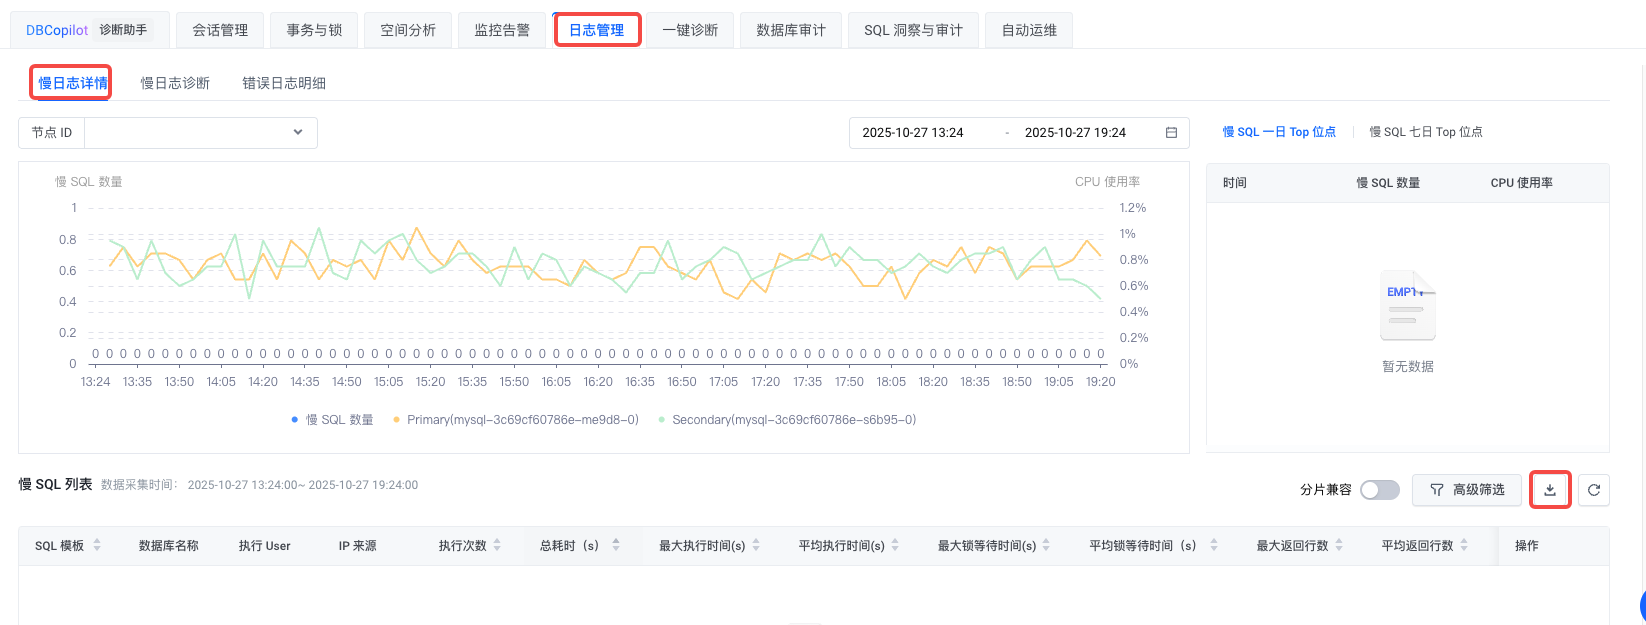
- Select the range of slow logs to download as needed. Currently, Export slow log details and Export current page are supported. The specific configurations are as follows:
- Export slow log details
- The exported slow log details include slow SQL that can be executed directly.
- Click Export slow log details. In the Export slow log details dialog box, configure the following parameters.
- ParameterDescriptionFile formatCurrently, only the CSV slow log format for downloads is supported. No selection is required.Export rangeSelect the range of slow logs to download as needed. Currently, Custom, Past 2 hours, Past 12 hours, and Past 24 hours are supported.Custom time periodSelect the time range for log export.tipThis parameter can be set when Export range is set to Custom.
- Export current page
- Click Export current page. In the Export slow logs of the current page dialog box, select the information included in the downloaded slow logs as needed.
- The current slow log download can include SQL template, Database name, Executing user, IP source, Execution times, Total time (s), Maximum execution time (s), Average running time (s), Maximum lock wait time (s), Average lock wait time (s), Maximum rows returned, Average rows returned, Maximum rows scaned, Average rows scanned, First appearance time, and Last appearance time, and Table name.
- Click OK.
- On the Slow log tab, clickicon, and then click Export history.
- In the Export History dialog box, select the target task whose Status is Generated, and click Download file in the Actions column.
Related APIs
API | Description |
Call the DescribeSlowLogs API to query slow log information. |
Last updated: 2026.09.01 16:57:38
All rights reserved © Beijing Volcano Engine Technology Co., Ltd2024
