Cloud Monitor
Cloud Monitor
Cloud Monitor


Document
What's new
Feature release history
Product Announcement
Announcement of Changes to Cloud Service Metrics
Overview
Getting Started
User Guide
Management permission
Cloud Service Monitor
Elastic Compute Service Monitoring
Monitoring plug-in (O11yAgent)
Alert Center
Alert policies
Alert templates
Object groups
Event center
Notification
Callback
Notification policy
Notification templates
Visual development
Best practices
Alert notifications
Alert policies
Cloud Monitor and Grafana Integration
API reference
Calling method
Alert contact groups
Alerting contacts
Query Cloud Service Monitor metrics or events
Event rule
Alert history
Tag management
Silence strategy
Alerting template
Notification templates
Troubleshooting
- Documentation
 Cloud MonitorUser GuideCloud Service MonitorElastic Compute Service MonitoringBasic monitoring
 Copy page
 Download PDF
Elastic Compute Service Monitoring
Basic monitoring
Copy pageDownload PDFBasic monitoring
To view the basic metric data of an Elastic Compute Service (ECS) instance, you need to go to the details page of the ECS instance. The ECS instance monitoring page only displays the performance data of ECS instances.
View basic metric data
- Log in to the Cloud Monitor console.
- In the left navigation bar, click Cloud Service Monitor. On the page that appears, click ECS.
- In the top navigation bar, select the target region.
- View the alert overview and resource distribution of ECS instances in the selected region within the current account.
-
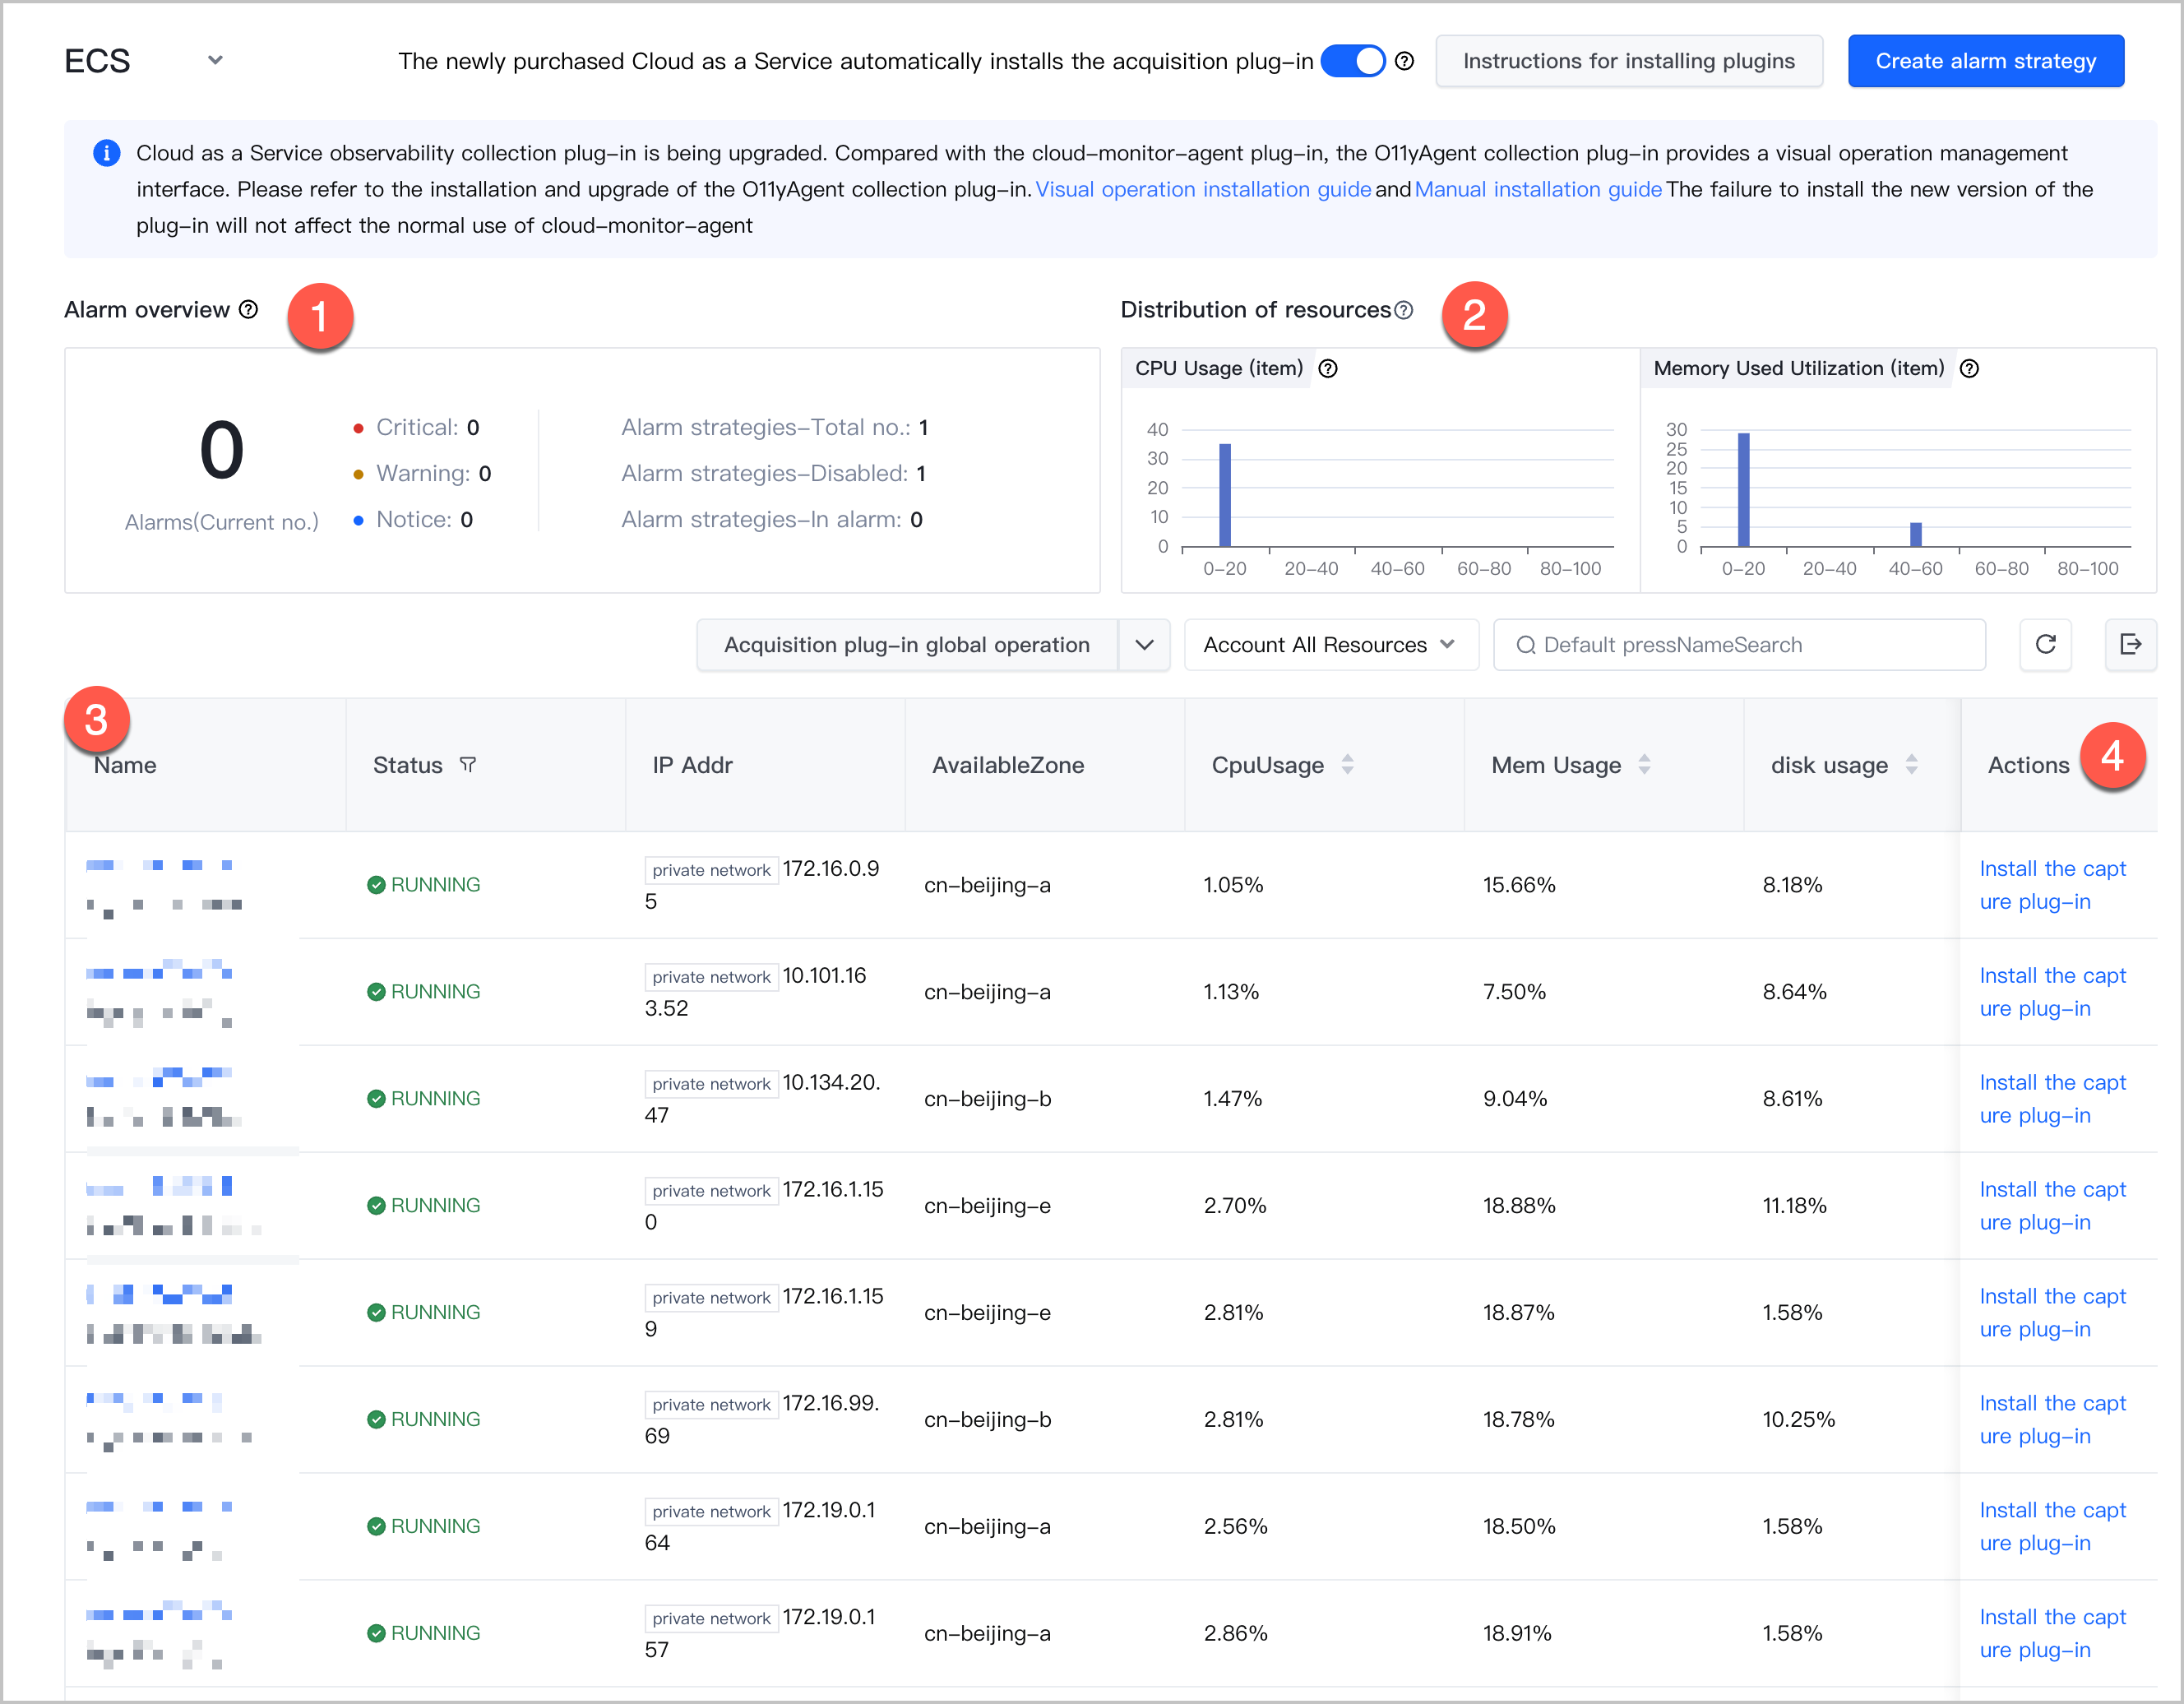
- No.SectionDescriptions①Alert overviewDisplays the alert overview information in the specified region within the current account, including:
- Number of current alerts: the total number of resource instances in the Alert state and the number of resource instances at different alert levels, which include Critical, Warning, and Notice.
- If you click the number of instances at a specific level, you are redirected to the Alert History page, where instances at the specific level will be automatically displayed in the list. You can view the detailed information about the instances. For more details, refer to Viewing alert records.
- Number of alert policies: the total number of alert strategies associated with resource instances and the number of alert strategies in different states, which include Disabled and In alert.
- If you click the number of alert policies in a specific state, you are redirected to the Alert policy page, where policies in the specific state will be automatically displayed in the list. You can view the detailed information about the policies.
②Distribution of resourcesDisplays the performance metric trend charts of ECS instances that are integrated with Cloud Monitor.③Resource instance listDisplays the names, status, and related metric values of ECS instances.④Export dataAllows you to export current data to an Excel file and download the file to your on-premises computer.
- Click the name of the target instance in the resource list to go to the monitoring details page. Click the BaseMonitor tab to view the basic metric data of the specified instance.
- No.SectionDescriptions1Monitoring time rangeYou can view monitoring data within the last day by default. You can also specify a custom query time range, which is accurate to minutes.
- You can query data in the last 30 days at most. The metric storage duration varies based on different cloud services. For more details, refer to Cloud service metrics.
- The query time range can be up to 15 days each time.
2Chart linkageAfter you select Chart linkage, you can quickly view the metrics and values at the same time point of all charts.3Cycle and MethodThe data collection interval and method in the chart.- Cycle: The interval at which the data is collected in the chart. The intervals slightly vary based on the selected monitoring time range. Valid values: 30s, 1m, 5m, 10m, 30m, and 1h. When the monitoring time range is greater than 7 days, the interval is fixed at 10m.
- Method: The method in which the statistics are collected in the chart. Valid values: Default value, Average, Maximum value, Minimum value, and Sum value.
Last updated: 2026.07.10 14:02:23
All rights reserved © Beijing Volcano Engine Technology Co., Ltd2024
