Cloud Monitor
Cloud Monitor


Document

- Documentation
 Cloud MonitorUser GuideMonitoring dashboard
 Copy page
 Download PDF
User Guide
Monitoring dashboard
Copy pageDownload PDFMonitoring dashboard
Cloud Monitor provides preset dashboards for some cloud products. If the single-instance dashboard in a product console does not meet your business requirements, you can use a preset dashboard to view multi-instance monitoring scenarios.
Limits
- The data storage duration varies based on different cloud services. For more details, refer to Supported cloud services.
- You can select up to 50 resources for a monitoring dashboard.
- The query interval can be up to 14 days on a monitoring dashboard.
- The time aggregation interval varies based on different query intervals.
- If 0 < query interval ≤ 6 hours, the aggregation interval is 30 seconds.
- If 6 hours < query interval ≤ 1 day, the aggregation interval is 1 minute.
- If 1 day < query interval ≤ 7 days, the aggregation interval is 10 minutes.
- If 7 days < query interval ≤ 14 days, the aggregation interval is 60 minutes.
View preset monitoring dashboards
This topic provides an example on how to view the monitoring data of multiple Elastic Compute Service (ECS) instances in the Cloud Monitor console.
- Log in to the Cloud Monitor console.
- In the left navigation bar, click Monitoring Dashboard.
- On the Dashboard Best Practice page, click the + icon before Elastic Compute and then click ECS/default.
-
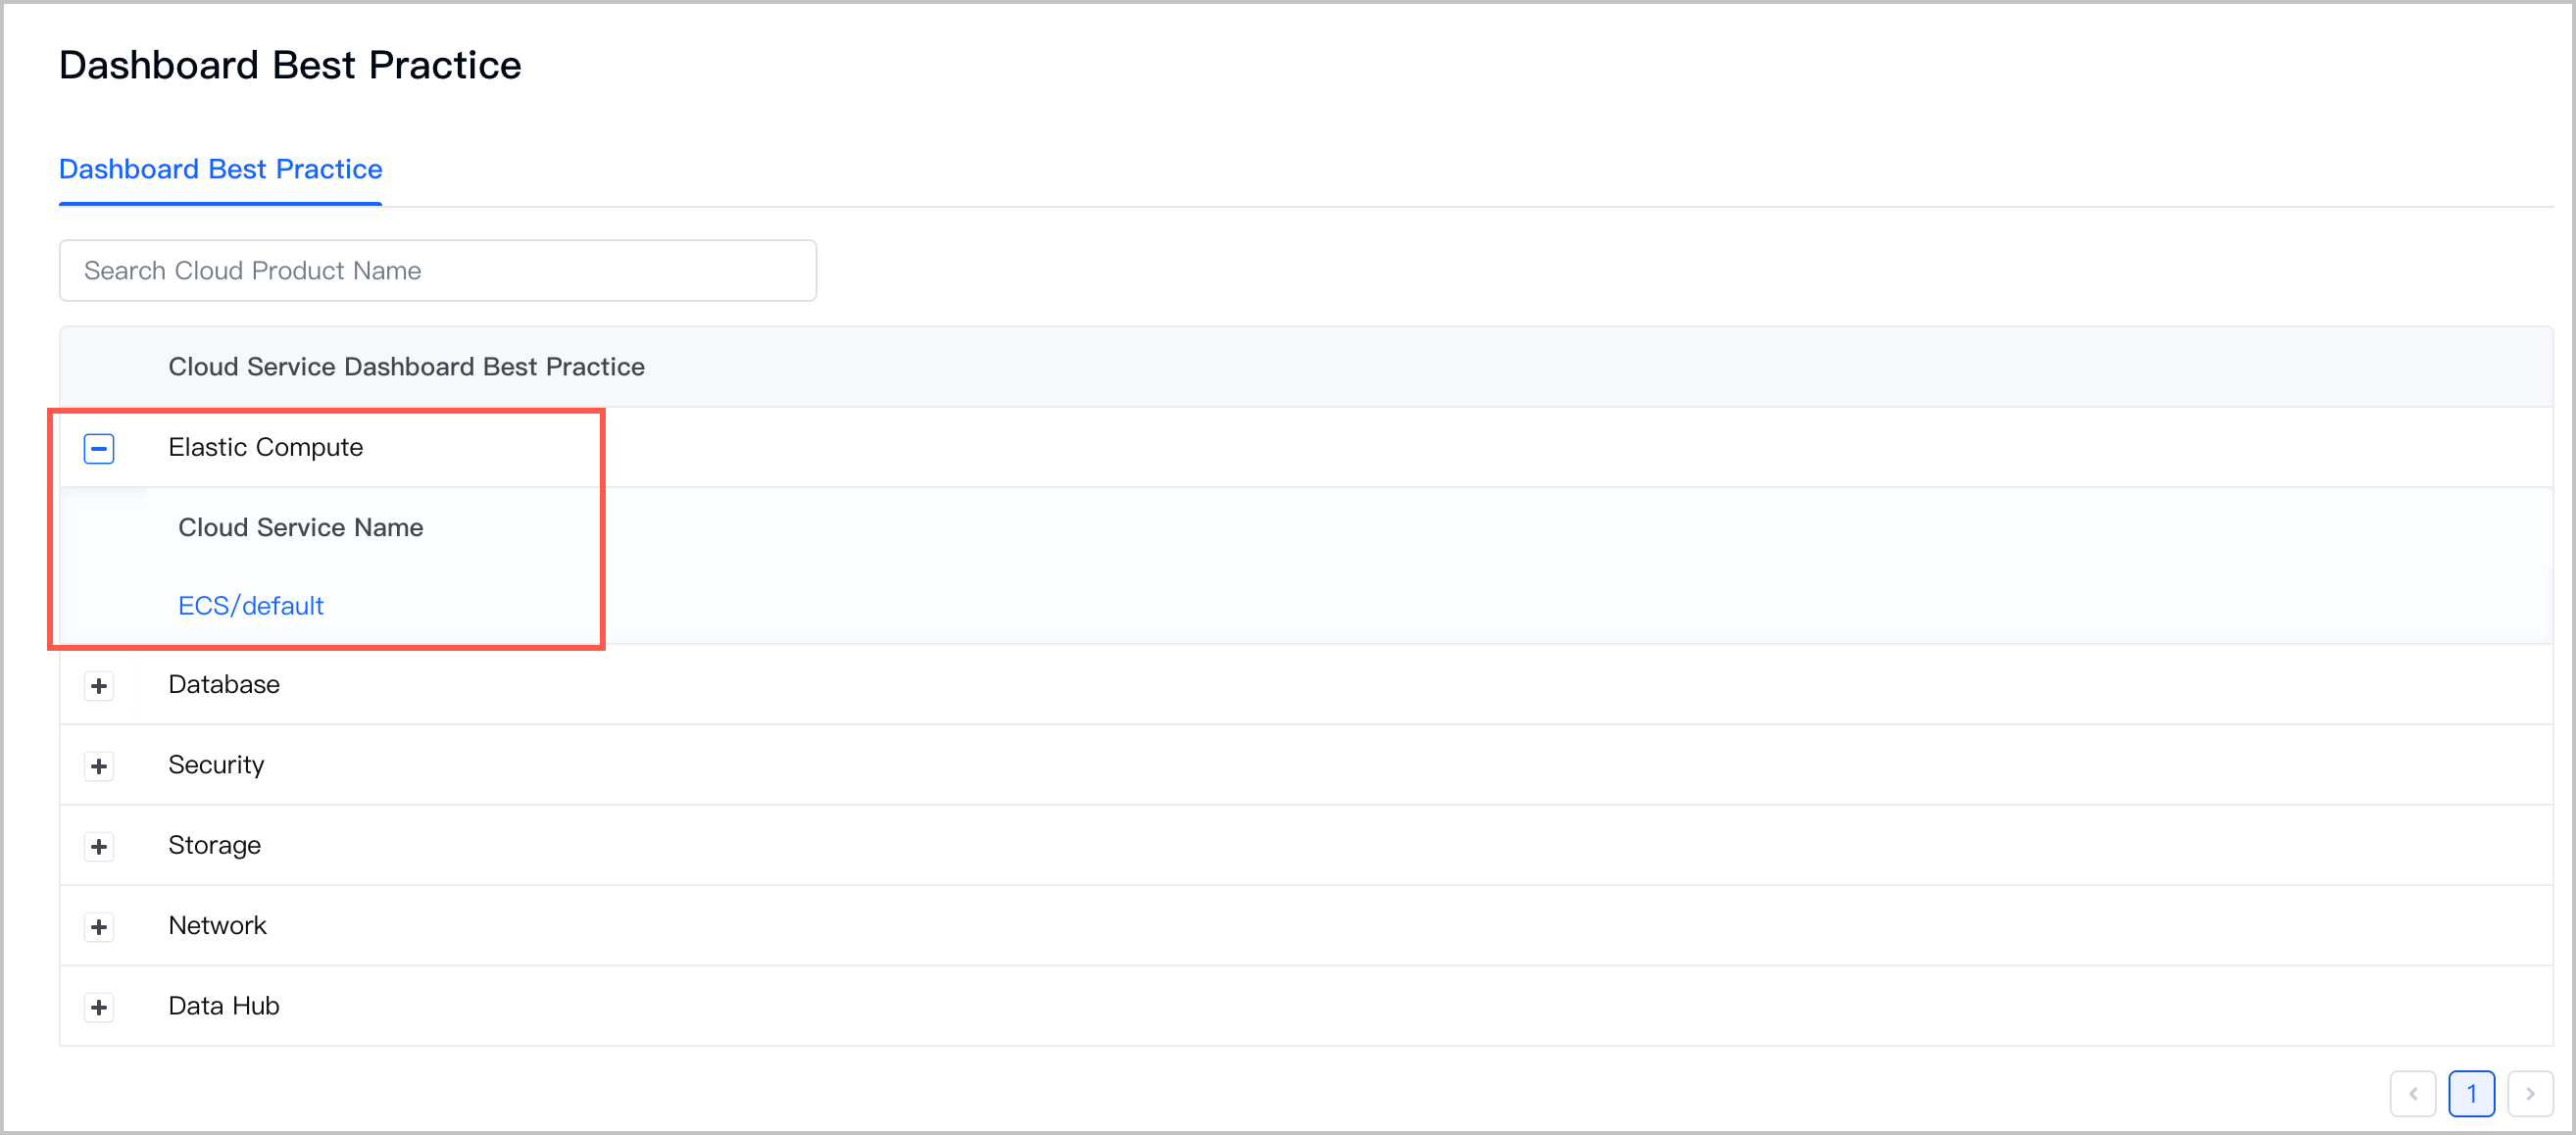
- On the ECS monitoring dashboard page, select the query interval, resource ID, instance, and disk. Then, you can view the corresponding monitoring dashboards.
tip
- When you select resource IDs, you can select a region and resources. You can select up to 50 resources.
- You can move the pointer over a chart to view metric values, and sort metrics by value.
-
Last updated: 2026.07.10 14:02:23
All rights reserved © Beijing Volcano Engine Technology Co., Ltd2024
