Cloud Monitor
Cloud Monitor


Document

- Documentation
 Cloud MonitorUser GuideAlert CenterViewing alertsViewing alert records
 Copy page
 Download PDF
Viewing alerts
Viewing alert records
Copy pageDownload PDFViewing alert records
After an alert of a cloud service instance is triggered, an alert record is automatically generated. The alert record records information such as the name of the faulty resource, the time when the alert is triggered, the duration of the alert, the alert level, and the name of the alert policy, which facilitates your viewing and reviewing the alert record in a centralized manner.
Limits
- An alert record can be stored for up to 14 days.
- If the number of alert records exceeds 5,000, only the latest 5,000 alert records are displayed.
- An alert record covers the period from the time when an alert of a resource instance is triggered for the first time to the time when the alert is cleared. If the alert is triggered again after clearance, another alert record will be generated.
Viewing alert records
- Log in to the Cloud Monitor console.
- In the left navigation bar, click Alert Center > Alert History.
- You can filter for the target alert record by specifying a time period and filter conditions above the alert record list.
-
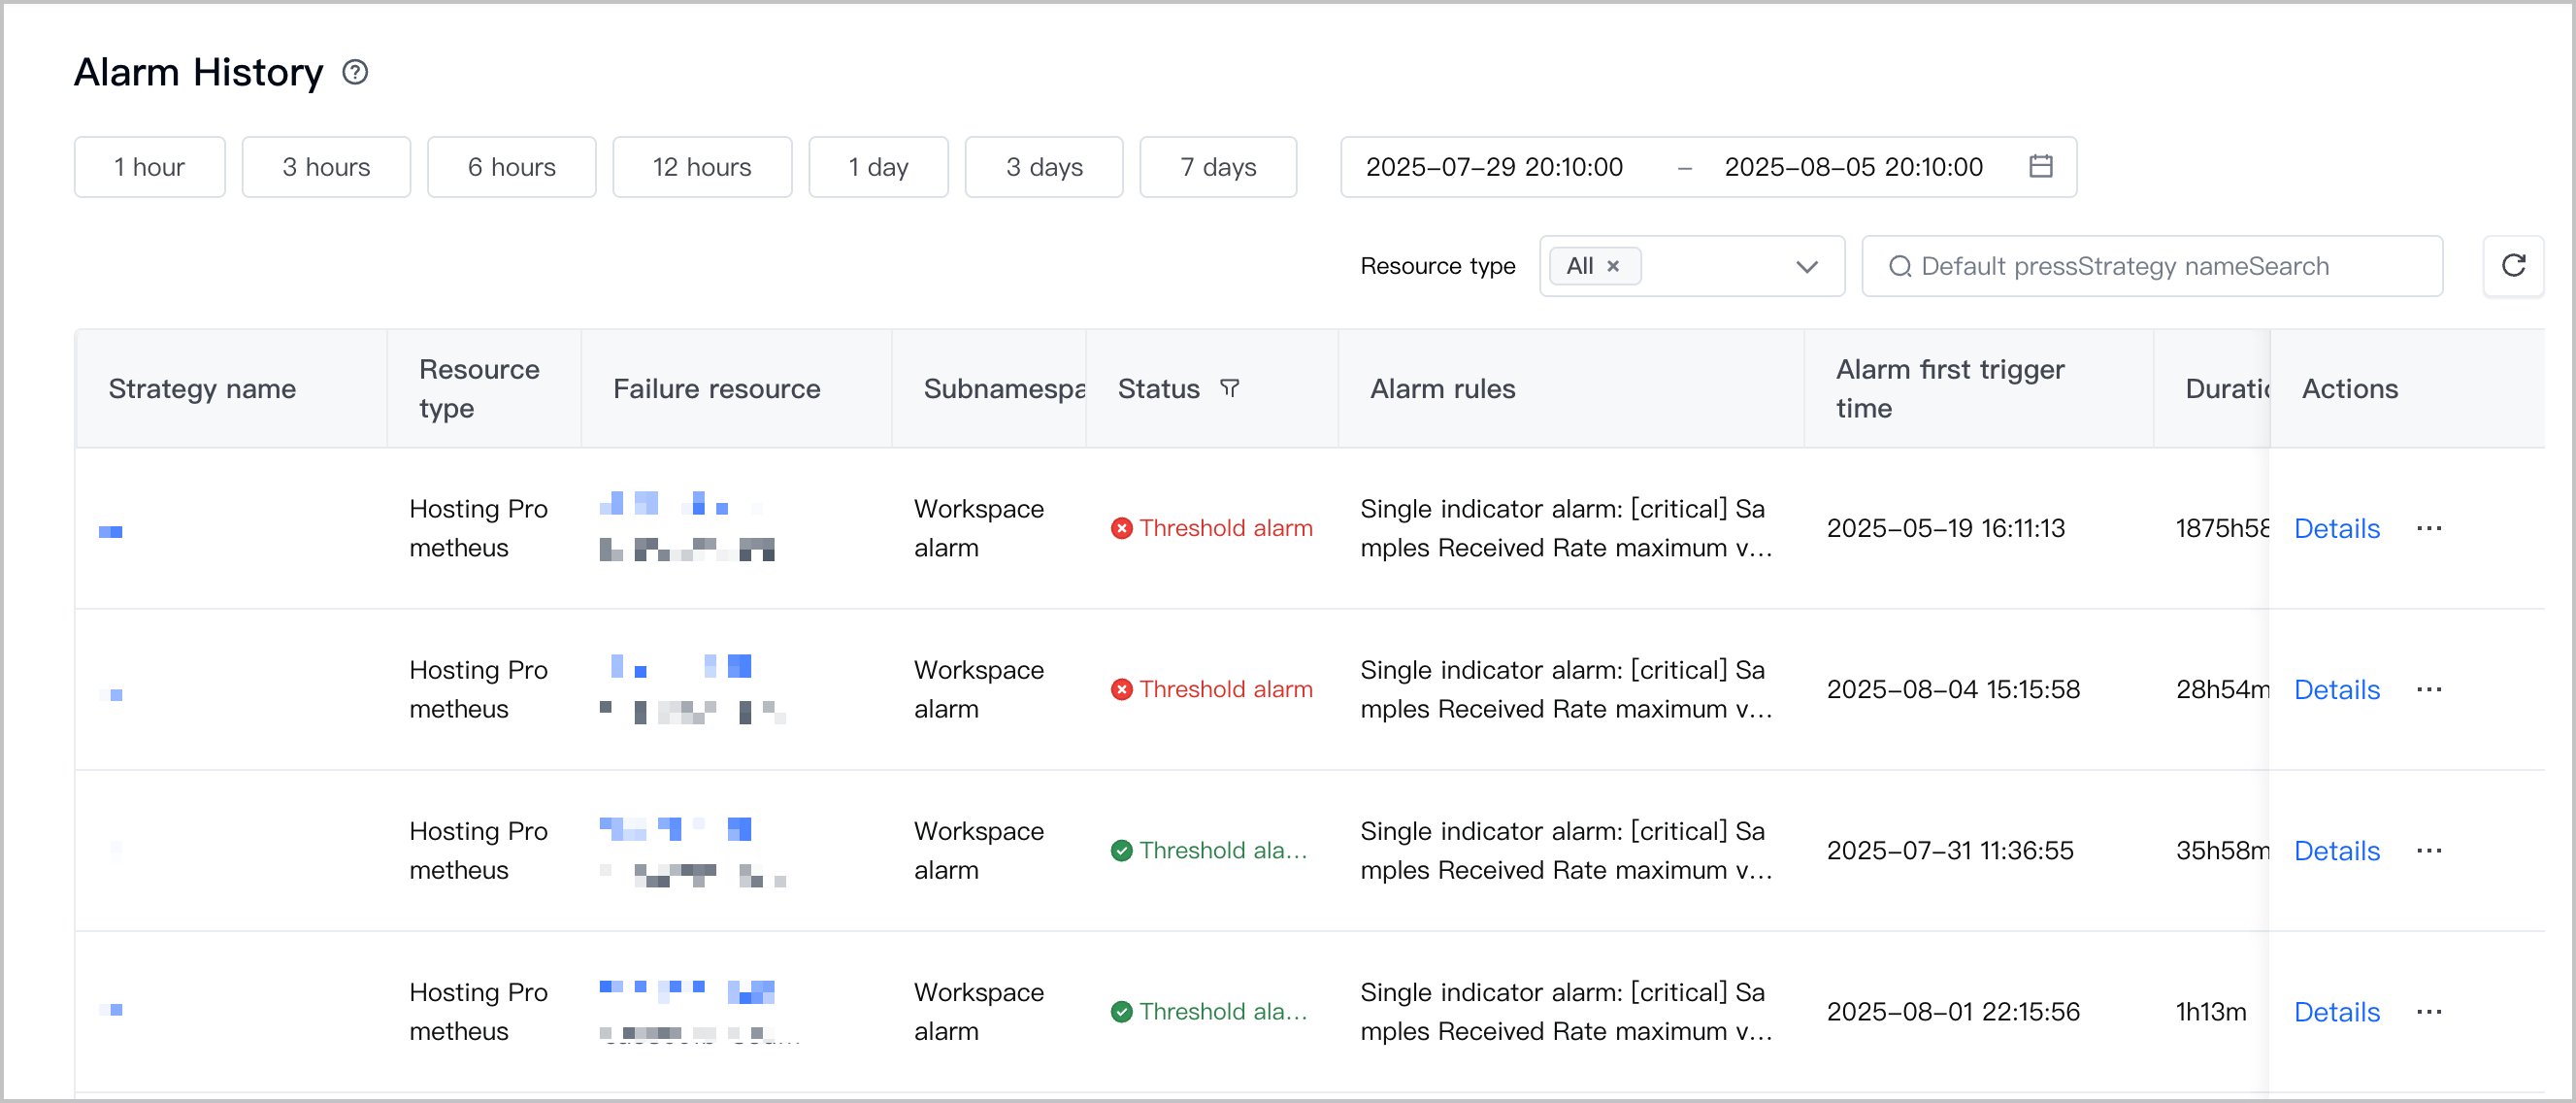
- The following table describes the meaning of each column in the alert record list.
-
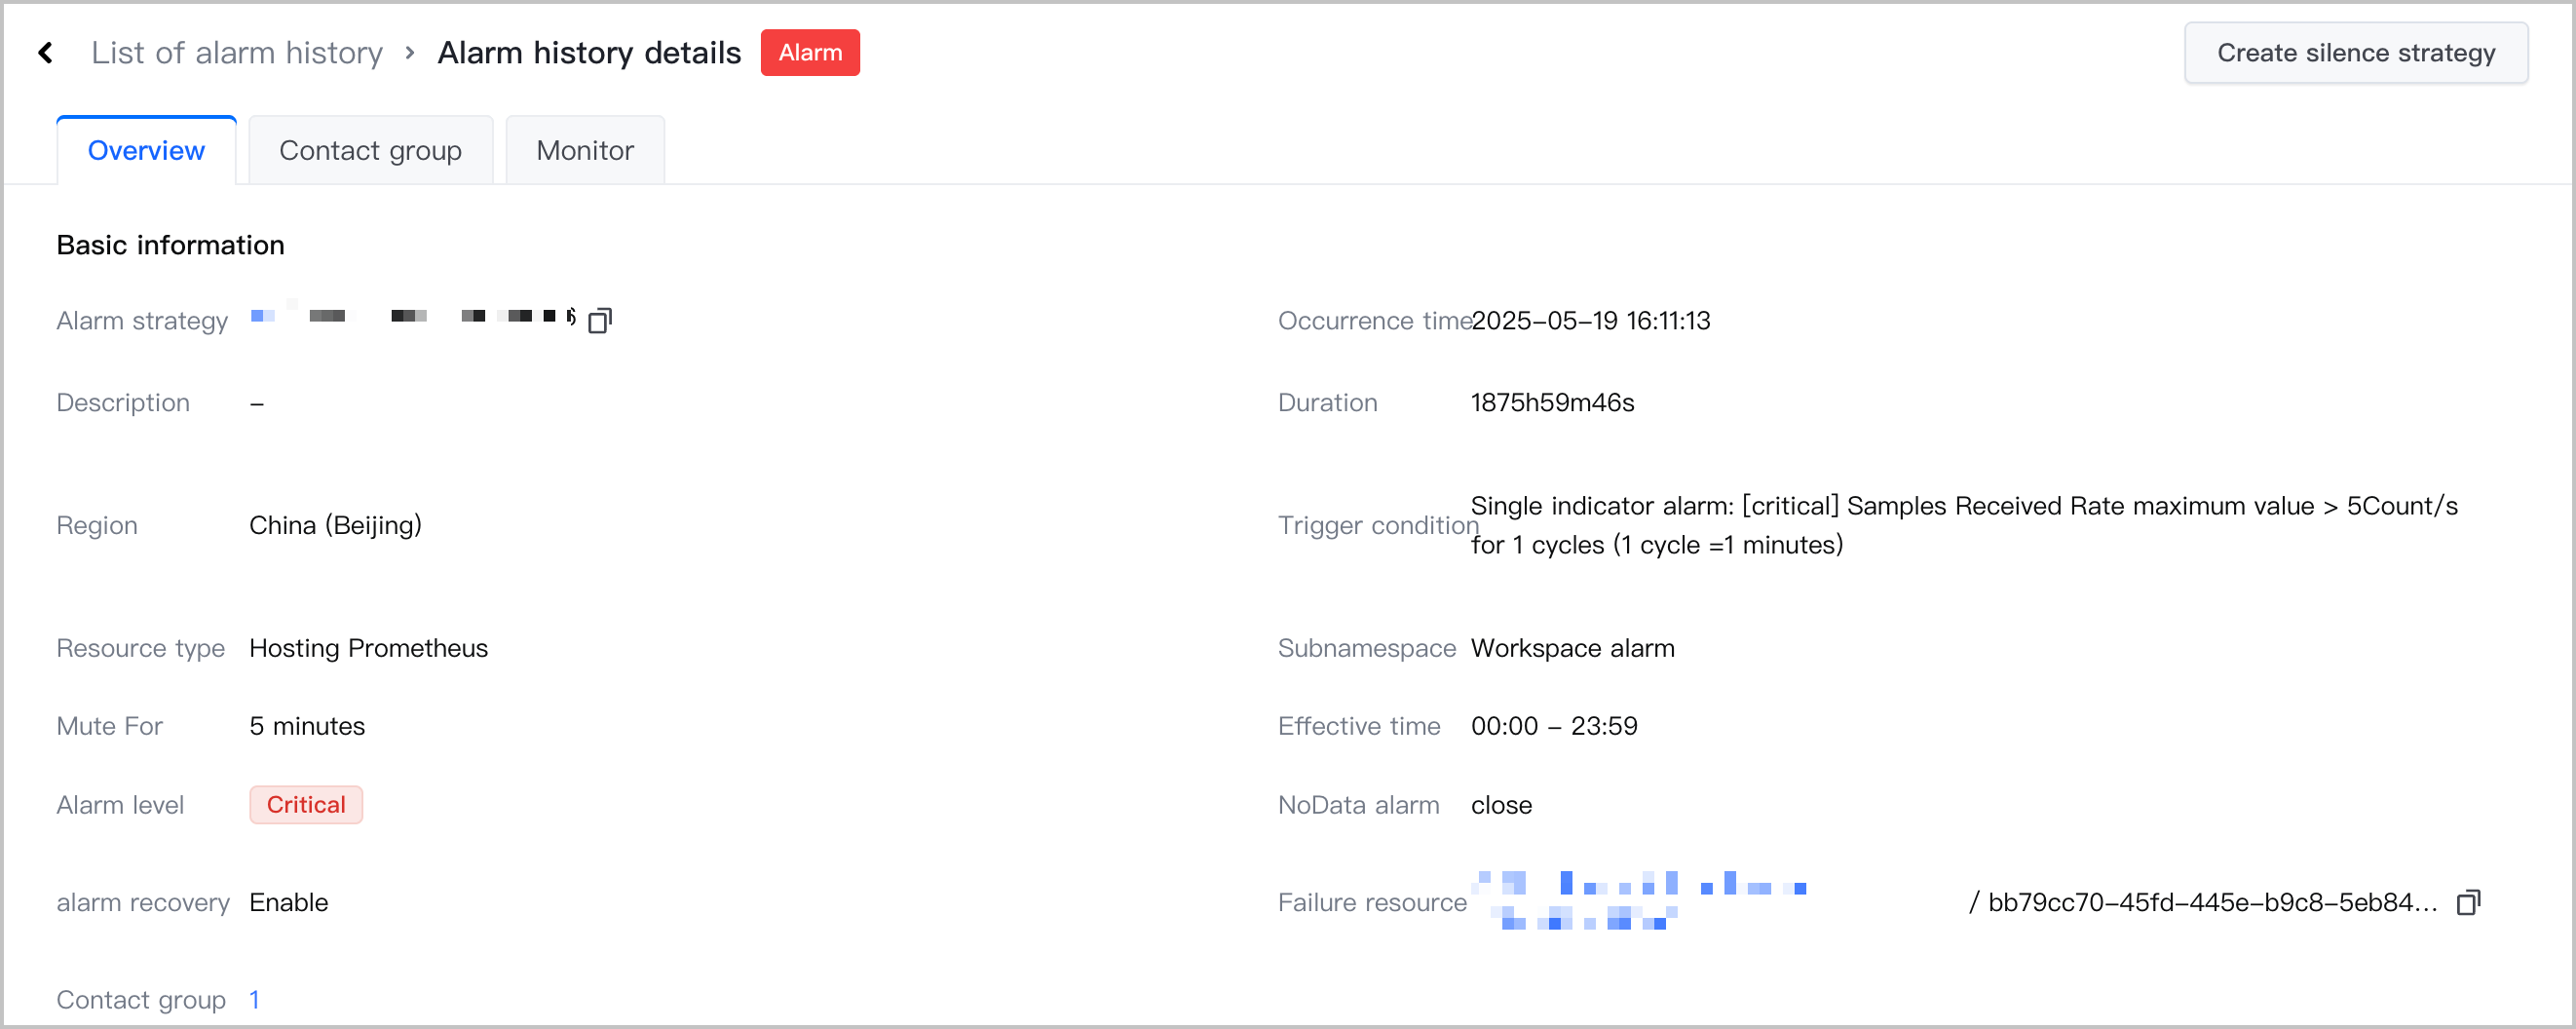
- Click Details in the Actions column that corresponds to the target alert record to go to the details page of the alert record.
- Overview:
- Basic information: displays the occurrence time, duration, faulty resource, and other information.
-
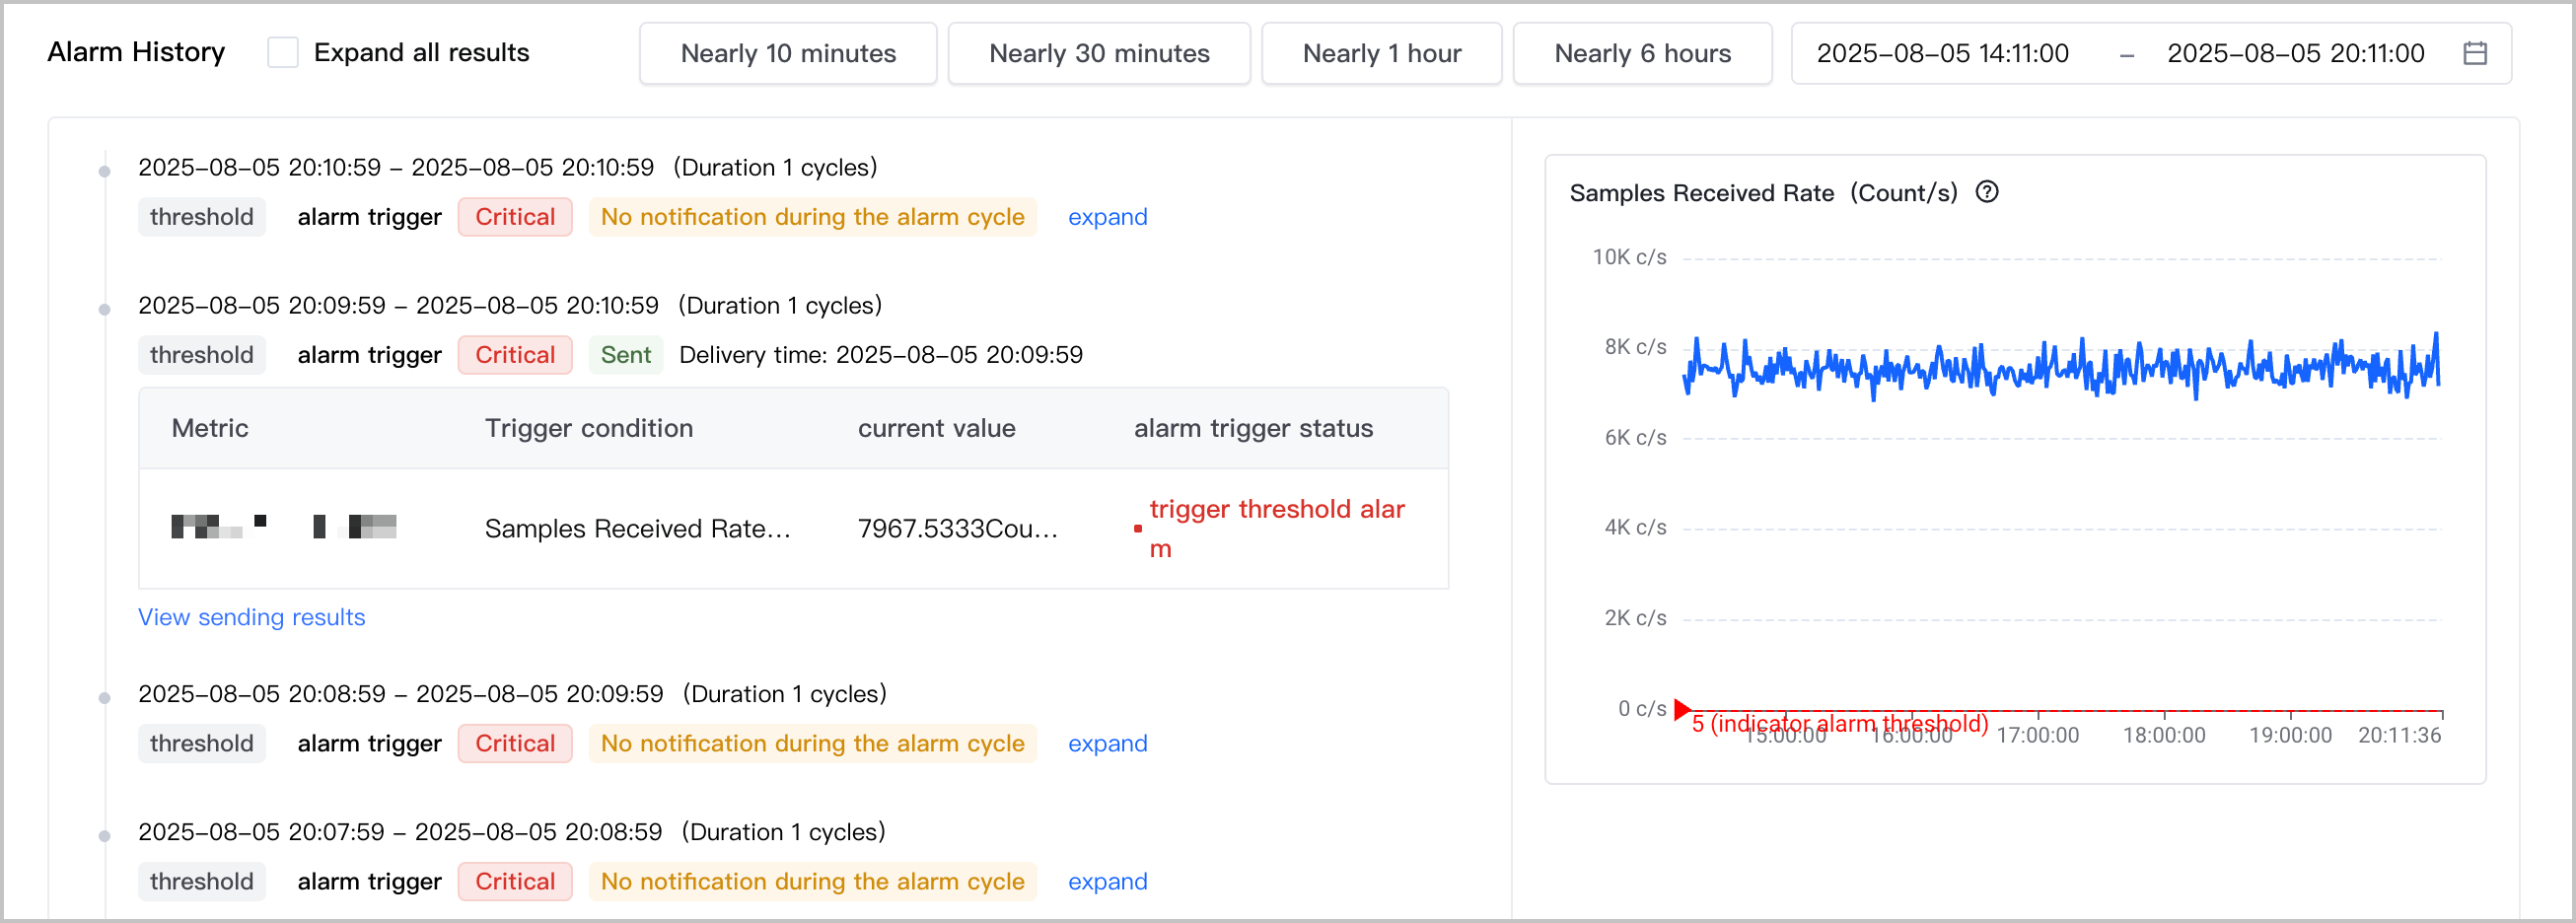
- Alert History: displays the trigger time, current value, trigger status, and sending status of each alert in the alert list and the corresponding trend chart on the right side.
-
- Contact group: displays the contact groups that receive alert record notifications.
- Monitor: displays metric dashboards and monitoring data.
Last updated: 2026.07.10 14:02:23
All rights reserved © Beijing Volcano Engine Technology Co., Ltd2024
