GPU Compute Service
GPU Compute Service


Document

- Documentation
 GPU Compute ServiceGPU Compute ServiceBest PracticesUsing second-level monitoring feature
 Copy page
 Download PDF
Best Practices
Using second-level monitoring feature
Copy pageDownload PDFUsing second-level monitoring feature
This topic describes how to configure and use the second-level monitoring feature provided by VolcanoEngine.
tip
This feature is in Beta. If you need a trial, please contact your account manager.
Scenario
In Large Language Model (LLM) training scenarios, a hybrid approach integrating Tensor Parallelism (TP), Pipeline Parallelism (PP), and Data Parallelism (DP) is widely adopted to minimize communication overhead. TP primarily involves intra-instance computation and communication, with relatively fixed implementations provided by NVIDIA. PP is a high-frequency activity (operating at 40 ms intervals) with millisecond-level single-execution latency. DP is a low-frequency activity (operating at 5s intervals) with 100 ms-level single-execution latency.
To help you resolve communication-related issues more precisely and efficiently, VolcanoEngine offers a second-level monitoring feature.
Prerequisites
- Create a Volcengine Managed Service for Prometheus (VMP) in the same region as your cluster. For more information, see Volcengine Managed Service for Prometheus.
Select an appropriate workspace type based on your actual needs.
- Execute the following command to check the version of the Cloud Monitor plugin and make sure that a version no lower than 3.16.0 is installed on the instance:
- LD_LIBRARY_PATH=/usr/local/cloud-monitor-agent/lib /usr/local/cloud-monitor-agent/cloud-monitor-agent version --config-file /usr/local/cloud-monitor-agent/config.yaml
tip
- If the plugin is not installed or the version is too low, reinstall it. For more information, see Installing plugin.
- If your instance cluster is large in scale, use the cloud assistant feature to quickly install the plugin. For more information, see Batch installing Cloud Monitor plugin.
- Make sure that Grafana is installed. For more information, see Install Grafana.
Procedure
Step 1: Enable the second-level monitoring feature
Cloud assistant-based configuration
When you enable the second-level monitoring feature on large-scale instances, you can use the cloud assistant feature to automatically complete the monitoring configuration in a batch.
tip
To enable the second-level monitoring feature for non-RDMA metrics, refer to the "Manual configuration" section below.
- Log in to the ECS console.
- In the top menu bar, select the region where your business is located.
- In the left-side navigation pane, select "Maintenance & Monitoring > Cloud Assistant" to enter the job management page.
- Select the "Custom commands" tab and click the "Create a custom command" button.
- On the "Create a custom command" page, configure the following information to create a custom command.
This topic only describes the differentiated parameters. For the complete parameter description, see Cloning to custom commands.
-
- Example:
- If your instance does not have the cloud assistant Agent installed, perform the following steps to install it.
- Batch installation in the console
- Click the "Agent management" tab, select the instances that require second-level monitoring, and install the cloud assistant Agent.
tip
You can batch install the cloud assistant Agent on multiple instances in the console. After successful installation, you need to restart the instances for the configuration to take effect.
- Install cloud assistant Agent by executing the scripts manually
- You can install the cloud assistant Agent in an instance by using the script provided by VolcanoEngine.
tip
After script-based installation is complete, you do not need to restart the instance.
- Installation through intranet
- Execute the following command in the instance to install the cloud assistant Agent through the VolcanoEngine private network.
- # Beijing Regionsudo bash -c "$(curl http://assist-client-beijing.tos-cn-beijing.ivolces.com/install.sh)"# Shanghai Regionsudo bash -c "$(curl http://assist-client-shanghai.tos-cn-shanghai.ivolces.com/install.sh)"# Guangzhou Regionsudo bash -c "$(curl http://assist-client-guangzhou.tos-cn-guangzhou.ivolces.com/install.sh)"
- or
- # Beijing Regionsudo bash -c "$(curl http://assist-client-beijing.tos-s3-cn-beijing.ivolces.com/install.sh)"# Shanghai Regionsudo bash -c "$(curl http://assist-client-shanghai.tos-s3-cn-shanghai.ivolces.com/install.sh)"# Guangzhou Regionsudo bash -c "$(curl http://assist-client-guangzhou.tos-s3-cn-guangzhou.ivolces.com/install.sh)"
- Installation through internet
- If an EIP is associated with your ECS instance, you can execute the following command to install the cloud assistant Agent through the Internet.
- sudo bash -c "$(curl http://assist-client.tos-cn-beijing.volces.com/install.sh)"
- or
- sudo bash -c "$(curl http://assist-client.tos-s3-cn-beijing.volces.com/install.sh)"
- Create a cloud assistant task to configure the second-level monitoring feature on the target instance.
- Select the "Job management" tab and click the "Create a job" button.
- On the "Create a job" page, fill in the information in the following table.
This topic only describes the differentiated parameters. For the complete parameter description, see Creating jobs.
-
- Click the "Confirm" button to complete the job creation.
- After the job is created, the system automatically redirects you to the Job management page. The new job then executes automatically based on its execution method.
- You can view the execution status and results of the job on each instance by following the instructions in Viewing job execution results.
Manual configuration
If you only need to use the second-level monitoring feature on a few instances or need to enable second-level monitoring for non-RDMA metrics, you can manually configure the second-level monitoring feature according to the instructions in this section.
- Execute the following command to open the /usr/local/cloud-monitor-agent/conf_plugin.json configuration file.
- vi /usr/local/cloud-monitor-agent/conf_plugin.json
- Press the i key to enter edit mode and modify the following parameters.
-
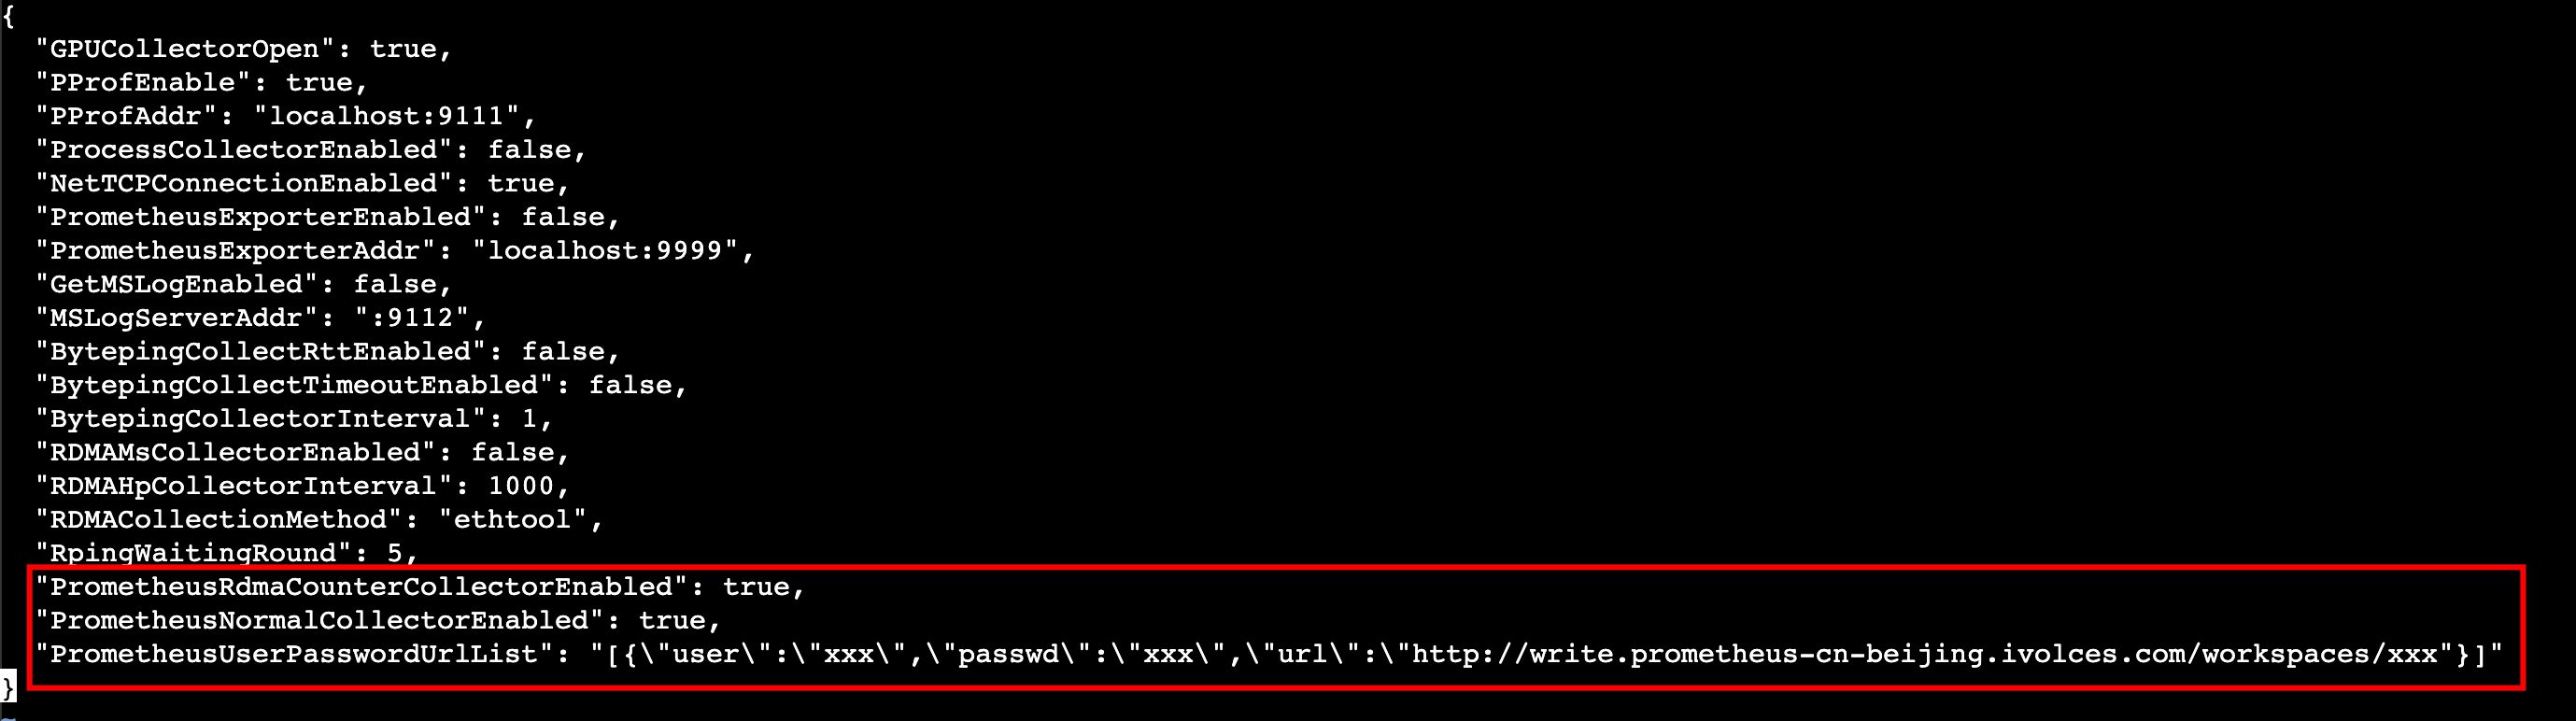
- Parameter descriptions:
-
- Execute the following command to restart the Cloud Monitor service.
- systemctl restart cloud-monitor-agent.service
Step 2: Configure Grafana
- Log in to Grafana.
- Click the "Toggle menu" button in the upper left corner, and then select "Connections > Data Sources" from the directory tree on the left.
-
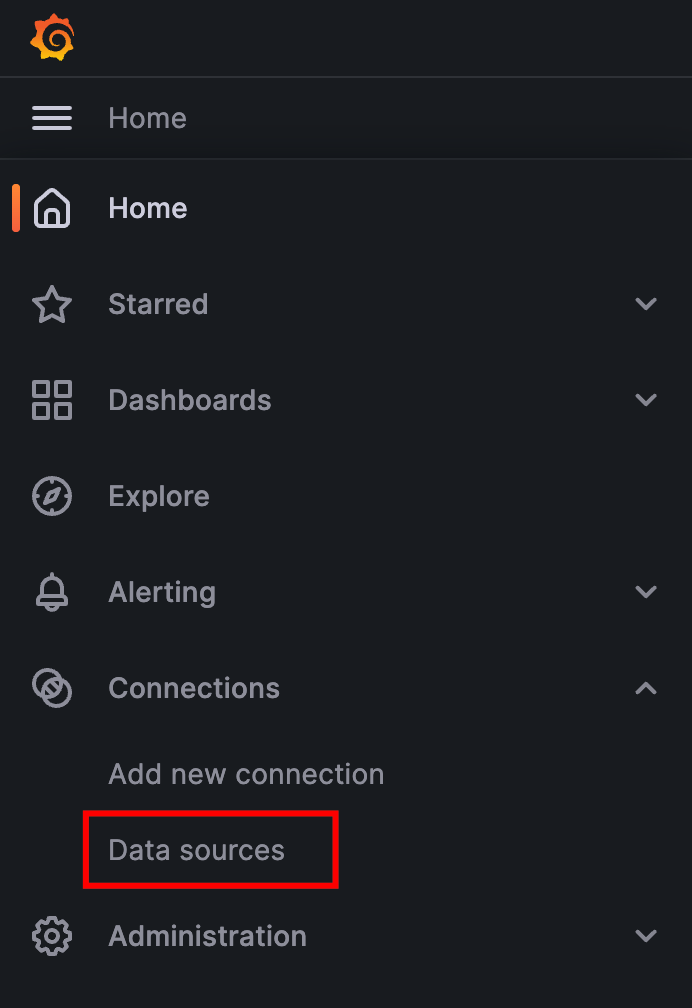
- Click the "Add data source" button, and search for and add Prometheus.
-

- On the "Settings" tab, configure the VMP data source.
-
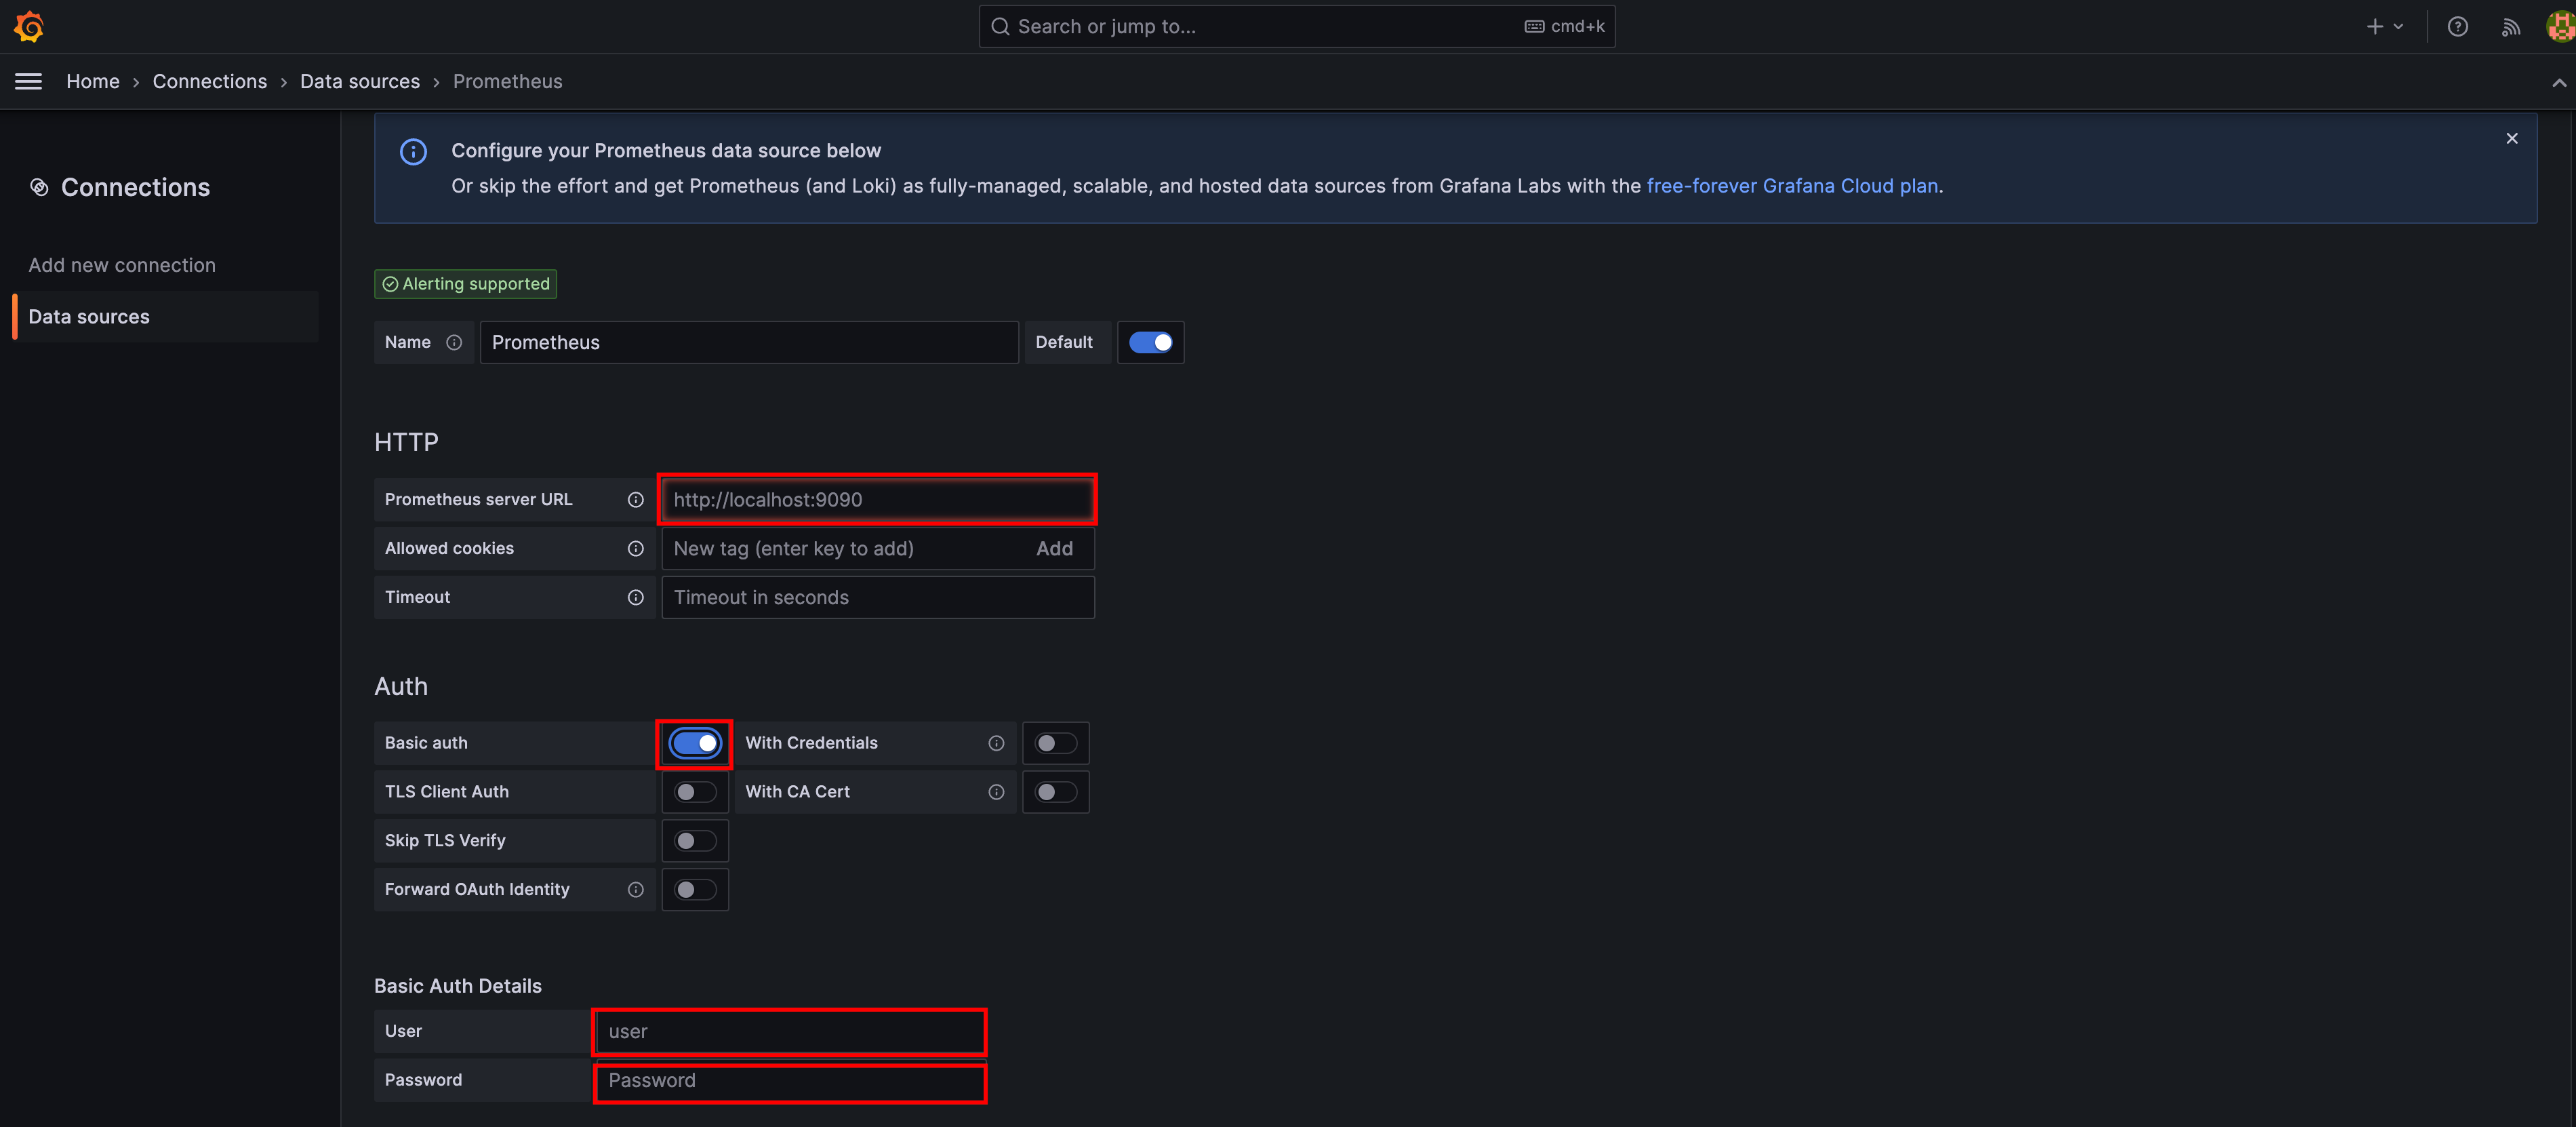
- Parameter descriptions:
- ParameterDescriptionPrometheus server URLBasic authEnable this feature to use VMP authentication information.UserEnter the VMP username.PasswordEnter the VMP login password for the corresponding user.
- After the configuration is complete, click the "Save & test" button at the bottom of the page.
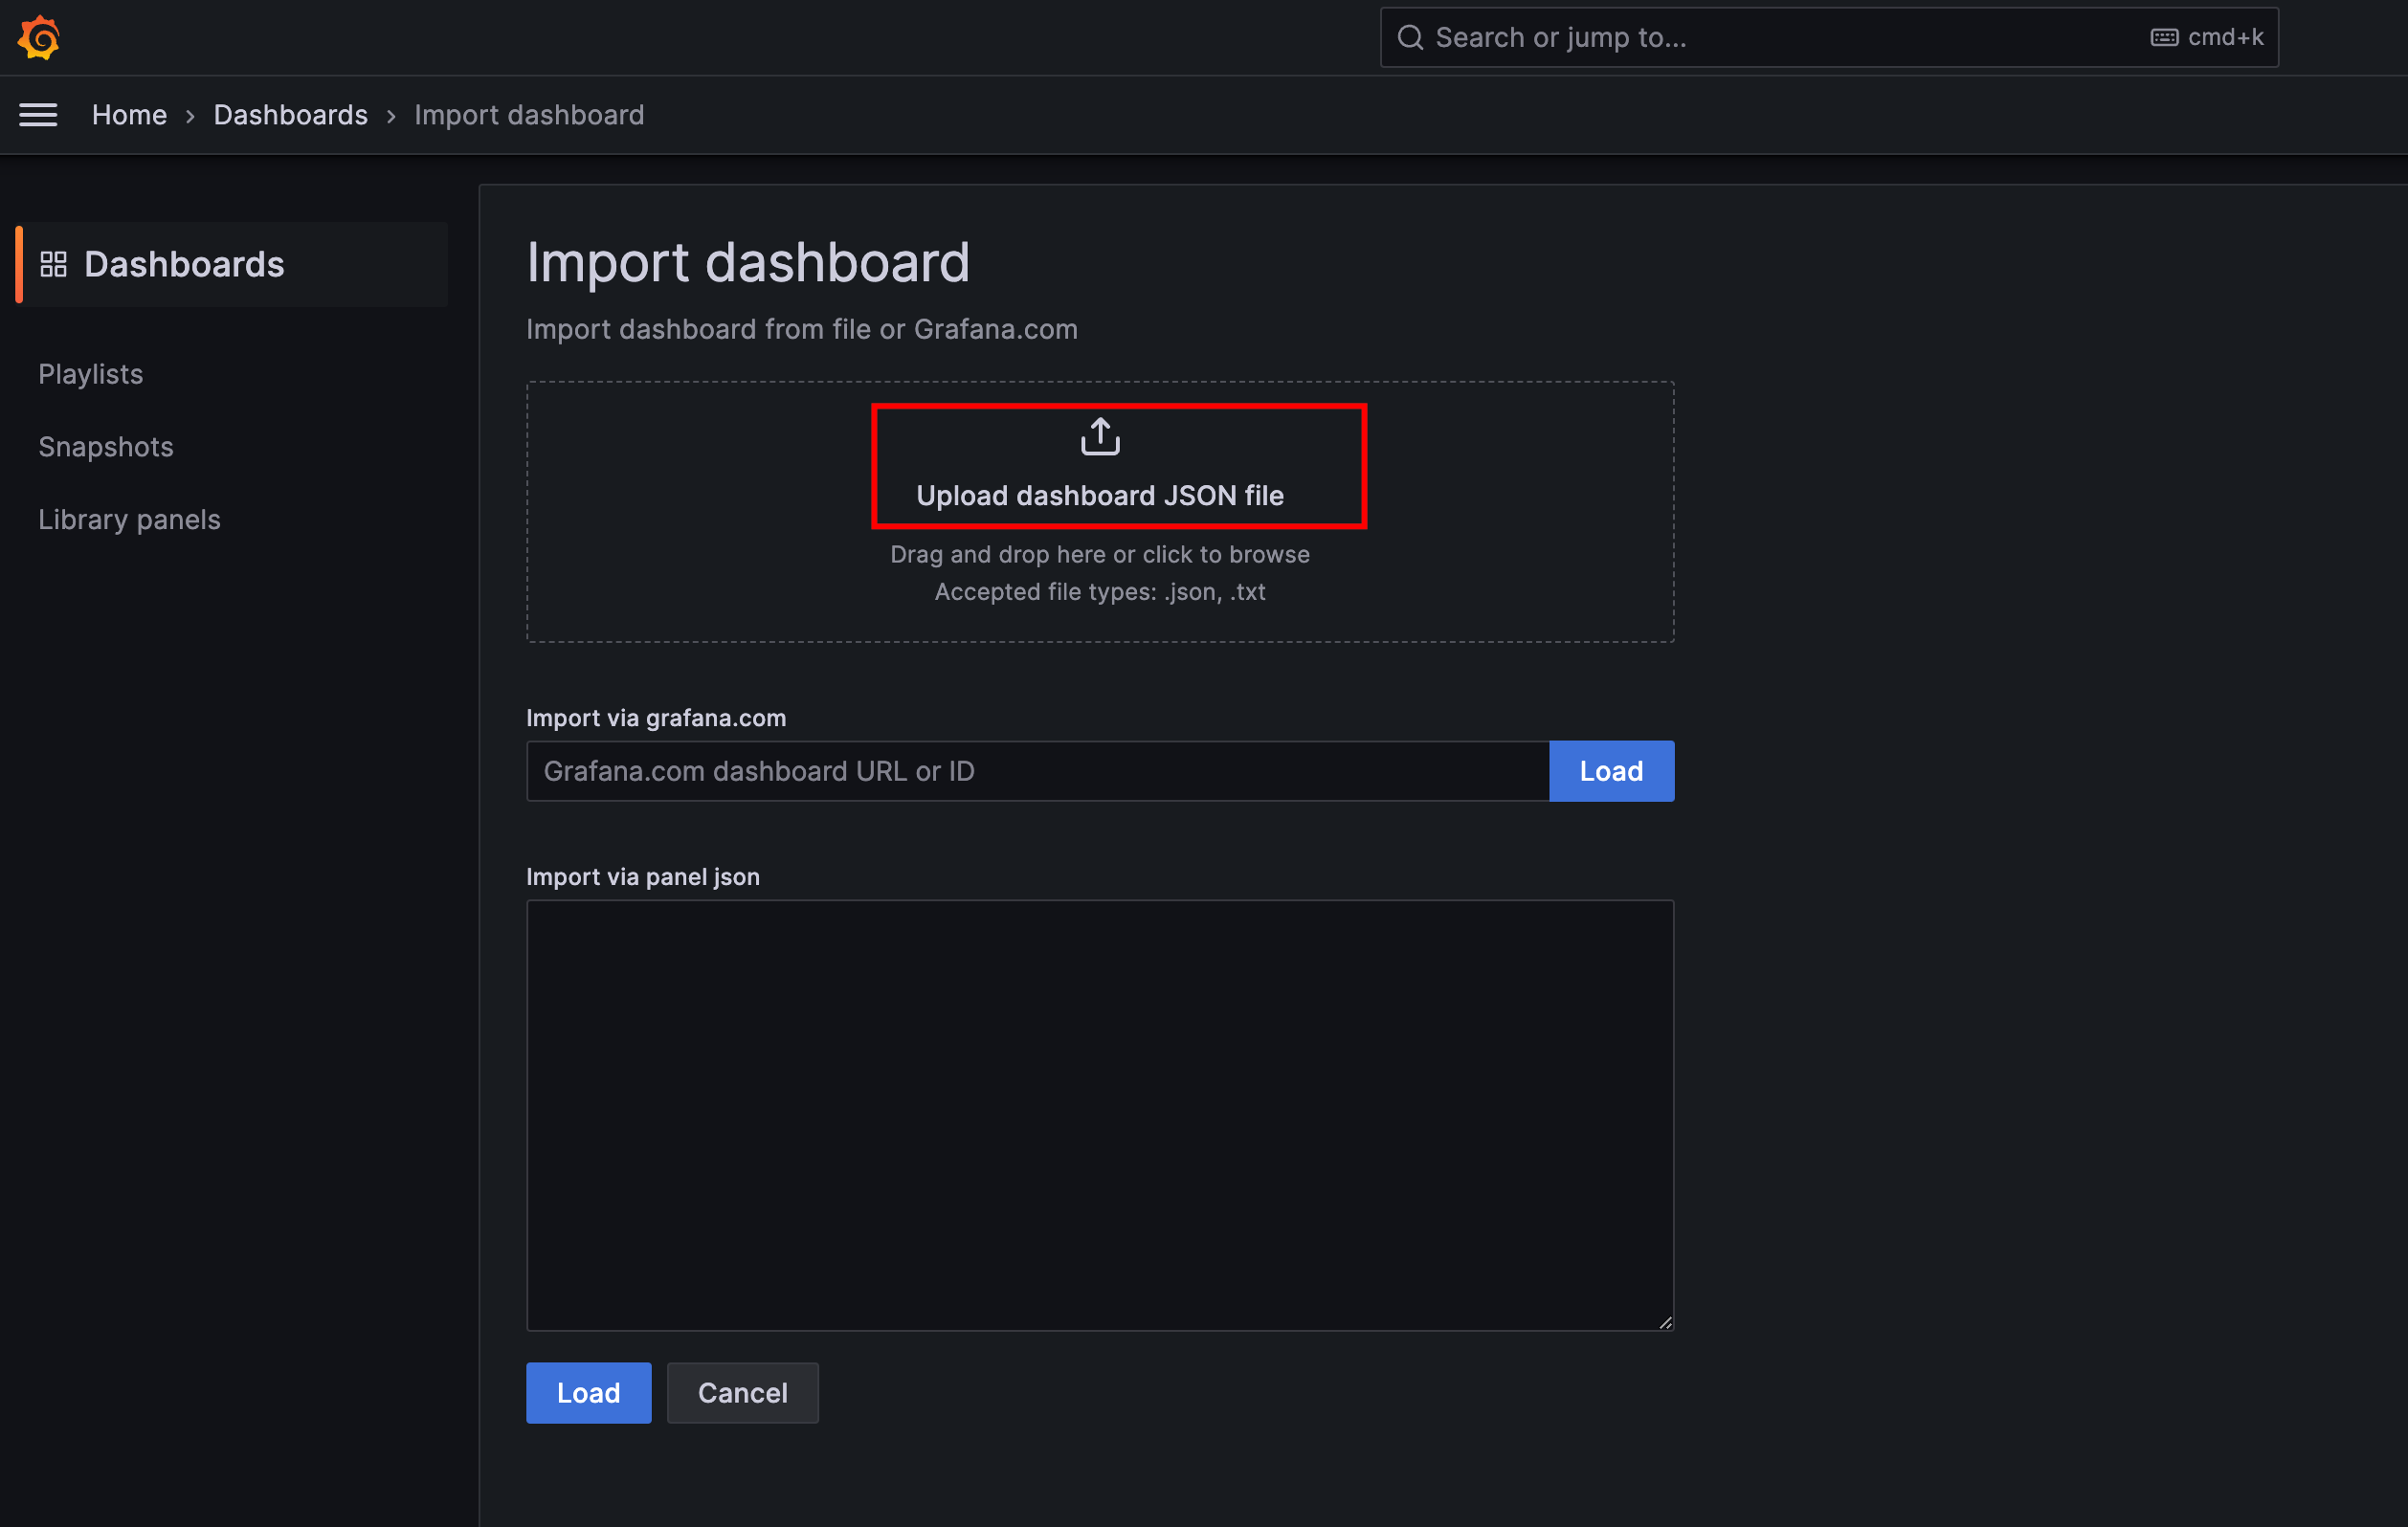
- Select "Dashboards" from the directory tree on the left, and choose "Import" from the "New" drop-down list on the right.
-
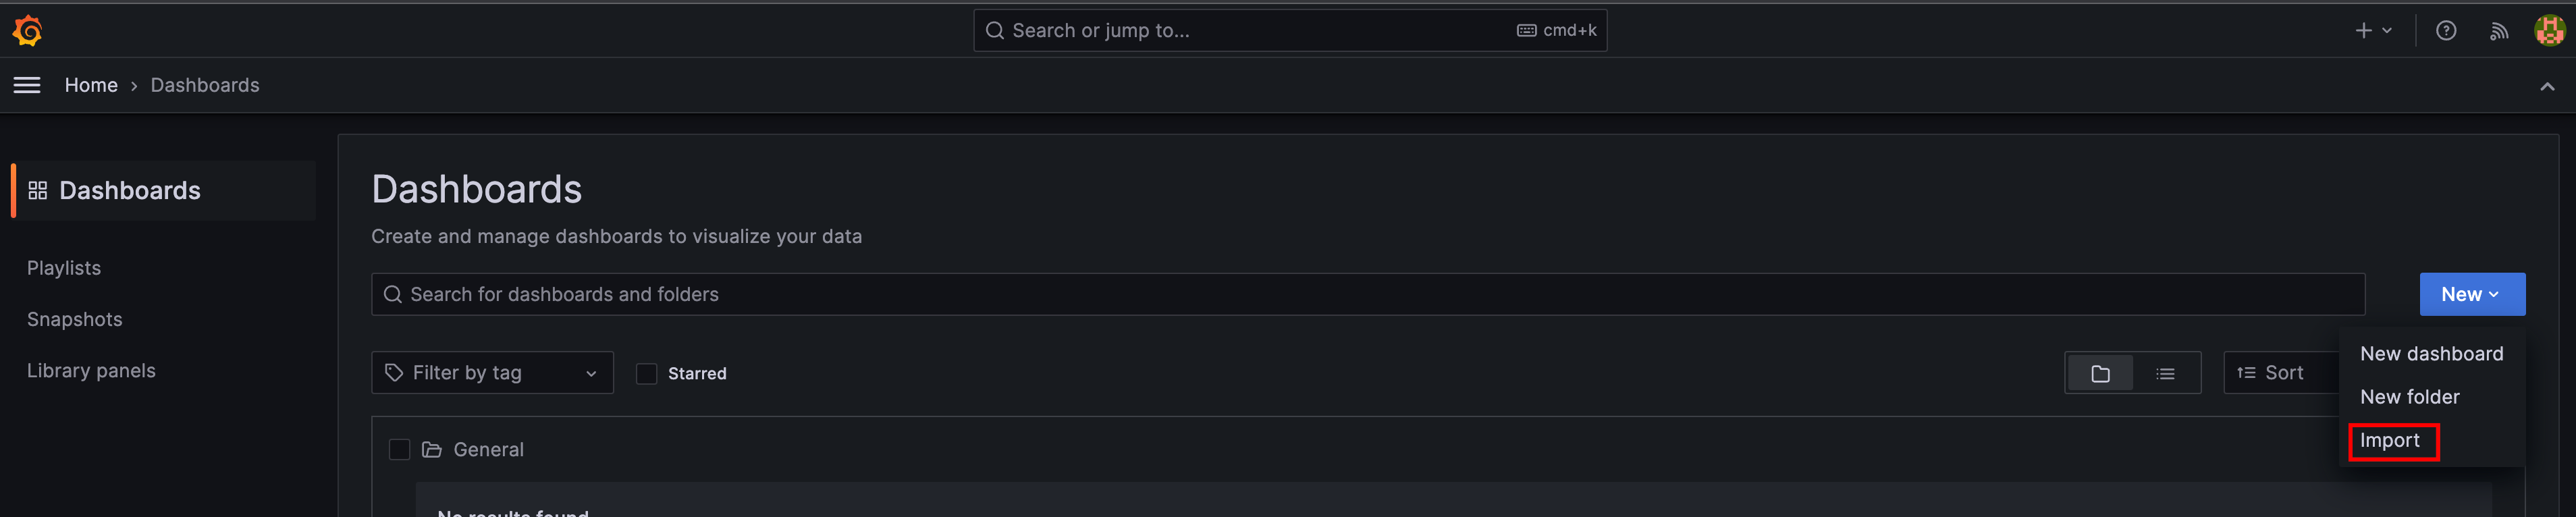
- Select the VolcanoEngine second-level monitoring JSON file, and click the "import" button to import the file.
tip
If you do not have the VolcanoEngine second-level monitoring JSON file, contact your account manager to obtain it.
-
-
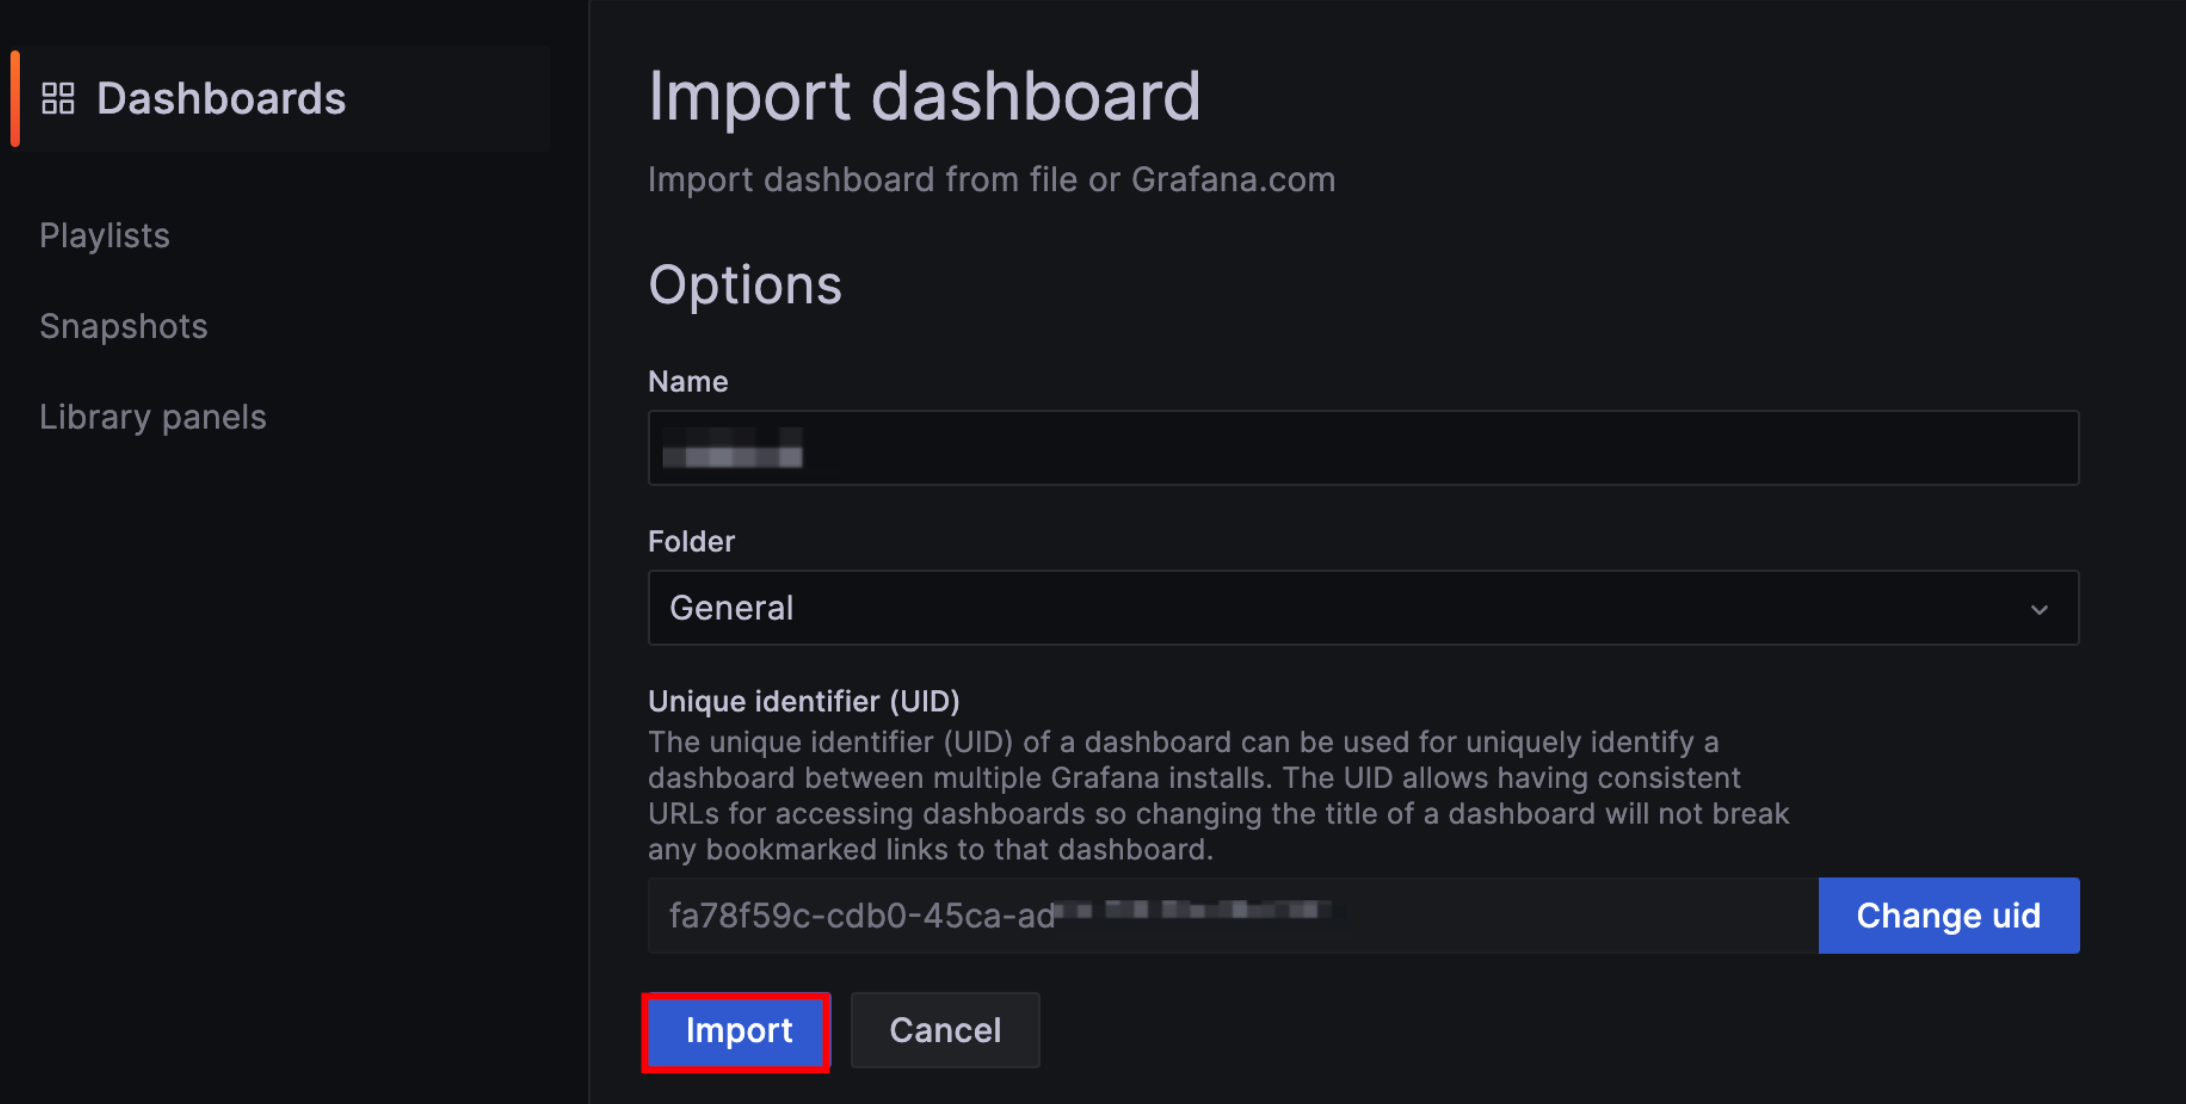
- After the file is imported, you can view VolcanoEngine instance second-level monitoring data directly in Grafana.
Last updated: 2025.12.03 15:45:51
All rights reserved © Beijing Volcano Engine Technology Co., Ltd2024
