Growth Analysis (Privatization)
Growth Analysis (Privatization)


- Documentation
 Growth Analysis (Privatization)Data Analysis and GovernanceAnalysis ToolAdvanced AnalysisHeat Map Analysis
 Copy page
 Download PDFCopy pageDownload PDF
Based on the user's behavior on the page, it is very intuitive to visualize the behavior of a large number of users through heat maps. This paper mainly introduces the heatmap scenario related to user click behavior and the way to create heatmap.
- When you need a comprehensive and intuitive understanding of user behavior on a page
Although other analytical methods can also provide some page-related data metrics, their correlation is low and requires mastery of some analytical methods. The page heat map makes up for this deficiency, it is more intuitive and simple, anyone can quickly grasp and understand its meaning. - When the user's click behavior changes before and after the page revision needs to be compared
You can compare the heat maps before and after the revision, and you can intuitively understand the difference in the user's click position. It is relatively simple to determine the effectiveness of the revision. - When it is necessary to further determine whether there is abnormal traffic based on the user's click behavior data
Some current traffic boosters can not only simulate visits, but also further create clicks. In response to this situation, if we only look at the data, we can only see an increase in traffic, but the conversion is not good. We determined by ua that it was not a crawler, but were unable to further locate other characteristics of these flows. But by clicking on the heat map, we can very intuitively find that these clicks are often concentrated in one point, or a few points, or very evenly distributed in certain positions on the page. This way, it can be judged that there is abnormal traffic behavior, providing an important basis for subsequent positioning problems.
The important point here is that the heatmap should not only contain links or buttons, but also include clicks on other non-clickable elements, because clicks on some non-clickable elements can better expose potential opportunities and problems.
The event used to render the heat map relies on the data of the full event tracking report, so before creating a new heat map, you need to confirm that the full event tracking switch is turned on in the SDK, and there is data full event tracking data reported.
Please refer to the SDK initialization section in the documentation for the corresponding client:
If full event tracking is turned on normally, you can User Detailssee the following events in the following events:
- bav2b_page: Used to define page view events.
- bav2b_click: Used to automatically report click events.
Add heat map
- Go to the heat map analysis page.
Click Navigation Analysis Tools > Advanced Analysis > Heat Map Analysis to enter the heat map analysis page, as shown below: - Click "Add heat map" on the "heat map analysis" interface, select the heat map you want to create, and choose "web end" and "mobile end".
The way to add heat maps is different from the mobile end, which is introduced below.
Web page
After entering the "web page" interface, click "Create merge page", as shown below:
After clicking "Create Merge Page", configure it in the Merge Page Configuration sidebar that pops up on the right.
tip
Merging pages is used to define multiple pages with the same content but different URLs, or different content but the same structure as a single page, in order to analyze the data of the same or the same class of pages as a whole.
Configure page information.
Parameter
Configuration instructions
Base map address
The base map is a part of the heat map visualization, which is used as a background to show the location of user interaction data. Through the base map page URL, the page rules of the combined page can be preliminarily parsed, and the parsed page rules can continue to adjust the configuration.
Definition method
Support by URL or by title two ways to filter the definition page. See below for details on the configuration of filtering rules in both ways.
Configure filter rules.
When defined as "by URL":
Parameter
Configuration instructions
Domain name
Automatic recognition according to the configured map address.
Page path
Configure the page path parameters that need to collect full event tracking data for heat map analysis. The page path parameter matches the value of the page_path attribute in bav2b_page event in the full event tracking preset event.
Query parameters
Configure the page query parameters that need to collect full event tracking data for heat map analysis.
- If configured as
*, identifies the query for all values of the current path and subpaths. - If empty, the value of the current path is being queried.
Hash matching enabled
Choose whether to turn on hash matching as needed. If so, you need to configure the query path and query parameters for hash matching.
After the configuration is completed, you can view the page filtering rules to be followed by heat map analysis in the currently defined page to confirm that the configuration results are correct.
- If configured as
When defined as "by title":
Parameter
Configuration instructions
Page title
Configure the page title parameter that needs to collect full event tracking data for heat map analysis. The page title parameter matches the value of the page_title attribute in bav2b_page event in the full event tracking preset event.
Review and confirm the current definition of the page and its movement over the past 48 hours.
- The page shows you the page PV trend within 48h of the currently filtered page, helping you determine whether the current page filter rule configuration is correct.
- You need to ensure that the configured page has integrated data access SDK and turned on full event tracking, and the page has T + 1 data reporting, otherwise the PV data will not be displayed normally in the trend chart here.
Mobile end
Before starting to use, please make sure that the mobile end APP has been connected to the [mobile end SDK], so that the system can evoke the corresponding APP according to the Scheme information (for example, iOS end: iOS SDK Integration).
- After entering the "mobile end" interface, scan the QR code with WeChat to start, as shown below:
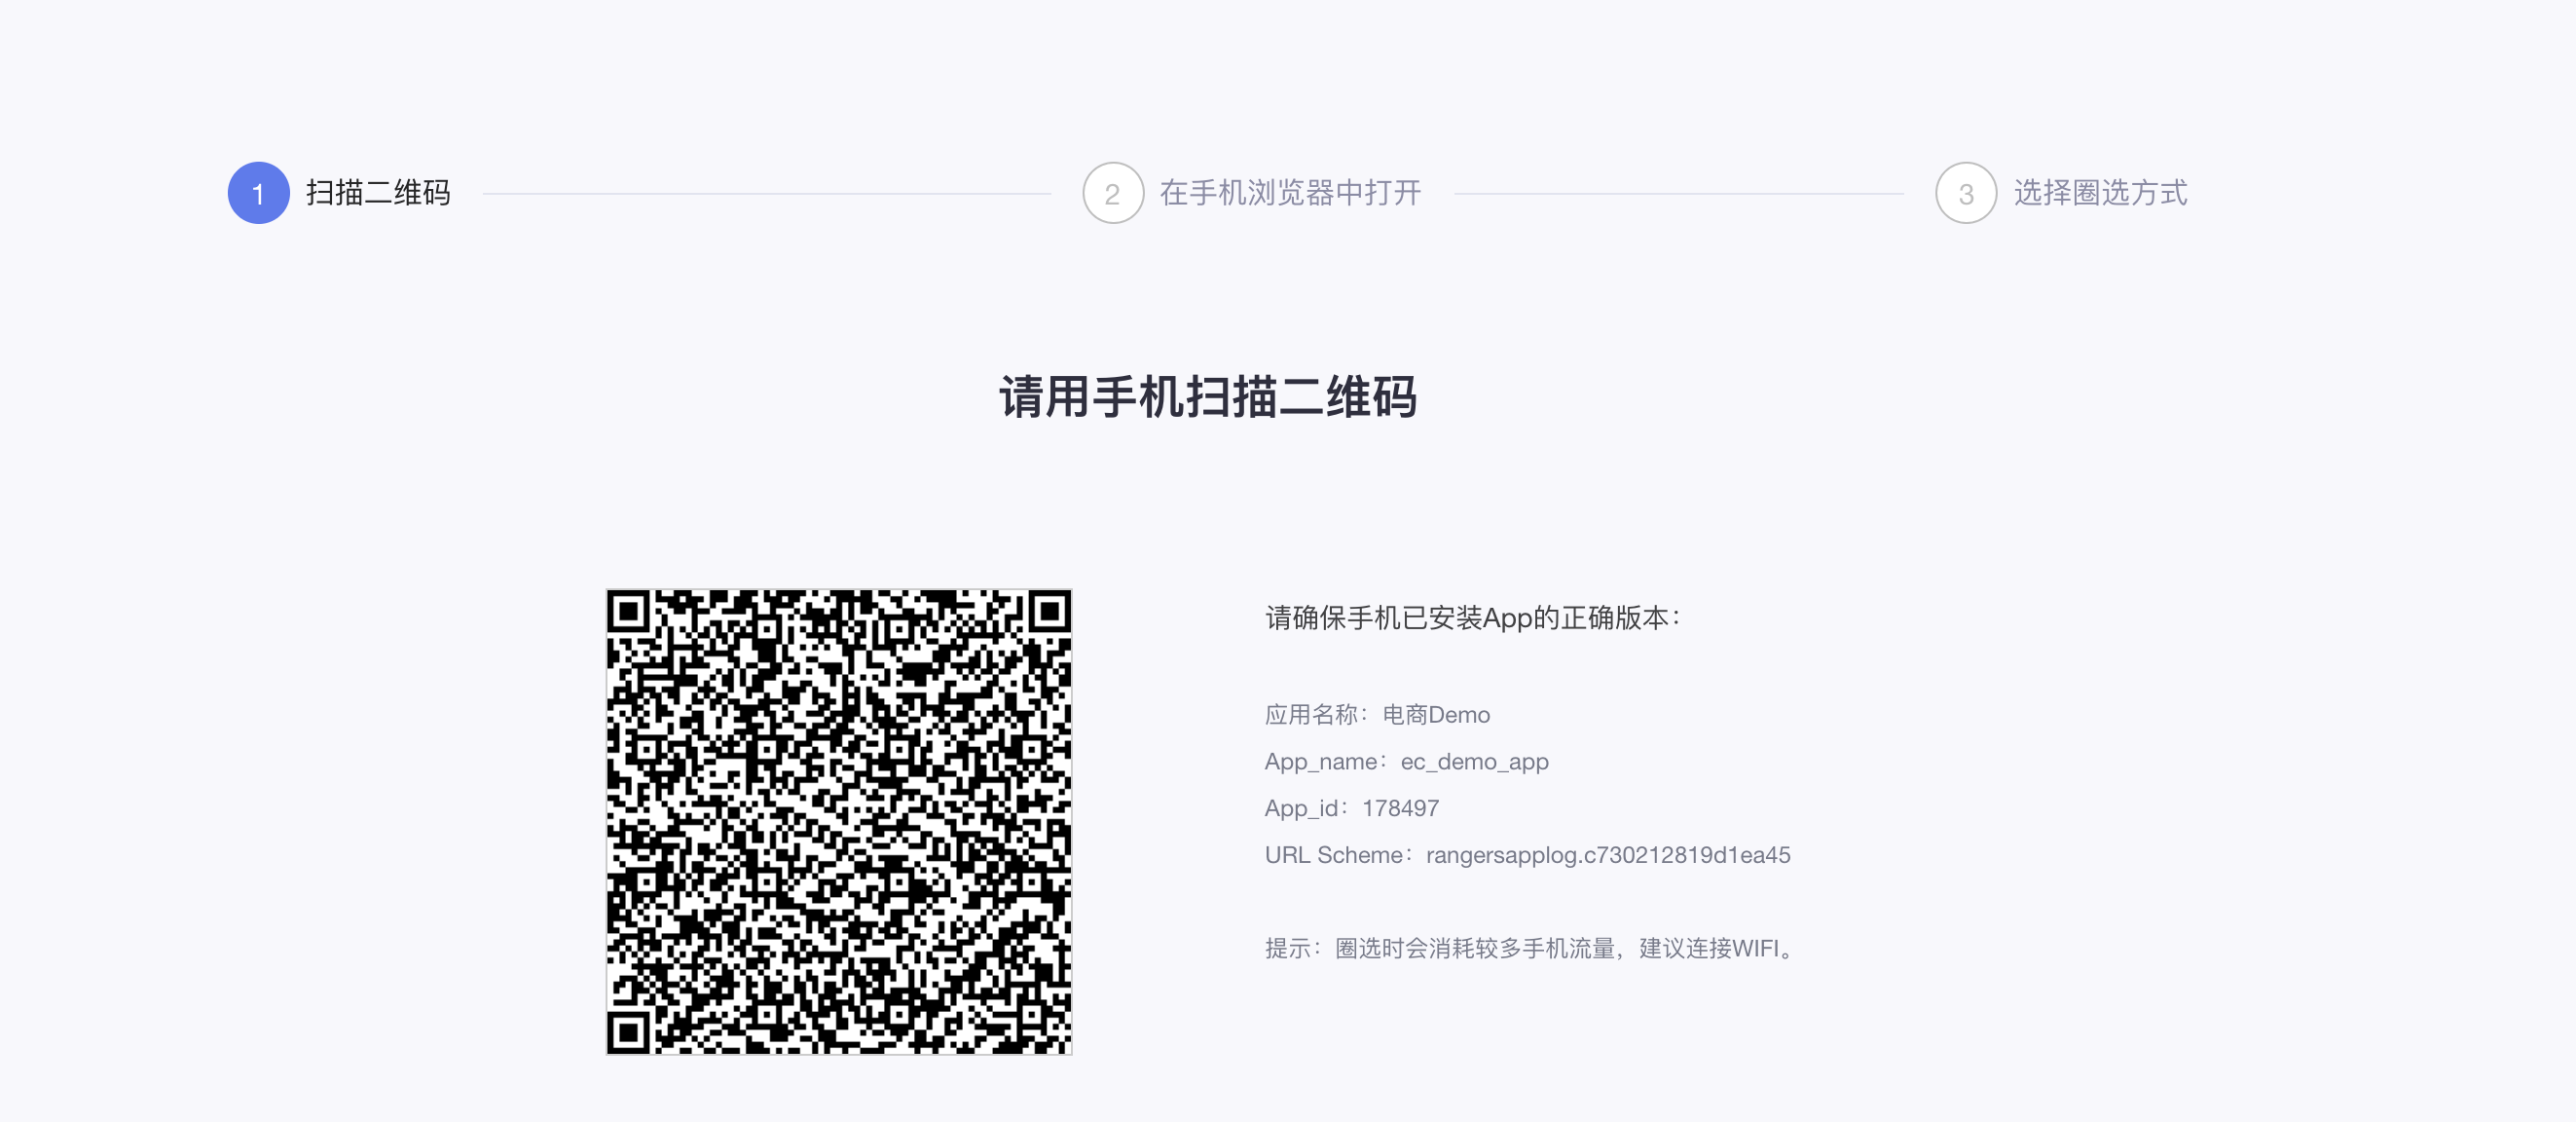
- Configure the mobile end.
After scanning the code successfully, follow the instructions in the mobile phone. The system will evoke the corresponding app according to the Scheme information in the QR code. At this time, the page presented by the app will be displayed on the "mobile end interface", as shown below: - Save a heatmap analysis.
Click the "Show Heat Map" button to display the following content. In the "Heat Map Name" edit box on the right, fill in the name of the current heat map, for example: "Home Heat Map Analysis". After the editing is complete, click Save and click "Close Heat Map". - Continue to configure the new heatmap analysis.
- If you want to continue to configure the new heatmap analysis, you can switch the page directly on the mobile phone. At this time, a prompt will appear on the heatmap configuration page in the DataFinder, as shown below:

- Click the black triangle button, as shown below:

- At this time, the page displayed on the computer will be synchronized with the mobile phone, then click "Show Heat Map", fill in the new heat map name, and after saving, the second heat map analysis will be added.
- If you want to continue to configure the new heatmap analysis, you can switch the page directly on the mobile phone. At this time, a prompt will appear on the heatmap configuration page in the DataFinder, as shown below:
Click to enter the defined heatmap to see that the page is divided into 3 parts.
The first part is used to set up, in line with other analysis modules, where you can select the filter conditions for the time range and user attributes (currently only all_value types are supported).
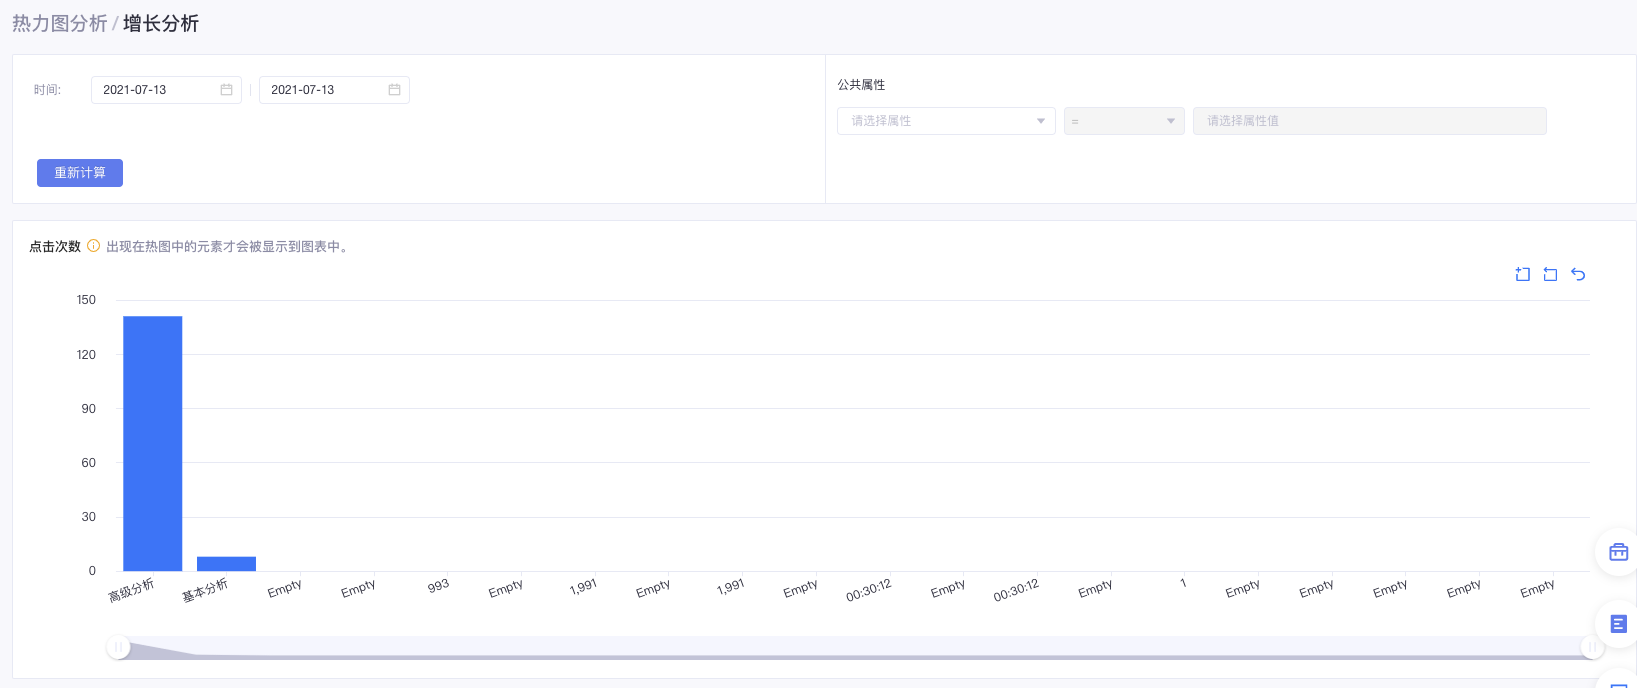
The second part is to view the distribution of elements by the number of clicks in the heatmap, and click on the column diagram corresponding to the element, which will also highlight the corresponding element in the heatmap below.
Indicator description:Data metrics
Indicator description
Overall data metrics
Number of people
The statistics calculate the total number of people who have entered the current page (the total number of people who have reported __bav_page events and are on that page).
Page views
The statistic calculates the total number of times the current page has been entered (__bav_page events have been reported and are the total number of times the page has been entered).
Click
The statistic calculates the total number of clicks on the current page (__bav_click events reported and the total number of times on that page).
Bounce rate
The statistics are calculated by dividing the number of bounces by the total number of visits, and the percentage display (the proportion of sessions containing only one event to the total number of sessions).
Average length of stay
Statistical calculation is the average length of all the current page stay, select __bav_beat/__bav_click these two events, the same user (hash-uid), page_start_ms as the starting event, since_page_start_ms the largest as the end time, their difference is the dwell time. Then the average of the total is the average length of stay.
First screen visibility time
The statistics calculate the page loading time of the first screen of the current page.
Click element related data metrics
Click count
Calculates the number of times the current element has been clicked in the time frame (__bav_click event reported and the total number of times in the area).
Click through rate
The number of people who clicked on the current element/the number of people who entered the current page, and the percentage display (reported __bav_click events and the proportion of users in this area to total users).
User
The number of people the current element was clicked on in the time frame, with the SSID as the caliber (the number of users in the region that reported __bav_click events).
Click ratio
The number of clicks on the current element/the number of clicks on all visible elements in the current area, as a percentage.
tip
- The result calculation logic of the click ratio is: Number ((A/B).toFixed (2)) * 100 and then keep 2 decimal places, which is a unique number operation mechanism of web JS, which will directly divide the result data by some rounding.
- As in the screenshot example above, the number of clicks on the current element A = 163; all visible elements in the current area are clicked B = 6496; then the click ratio is Number ((163/6496).toFixed (2)) * 100 Technologies 3.00%.
The third part is the heat map area. You can see the click heat distribution of elements on the page, and hover over elements to see more metrics.
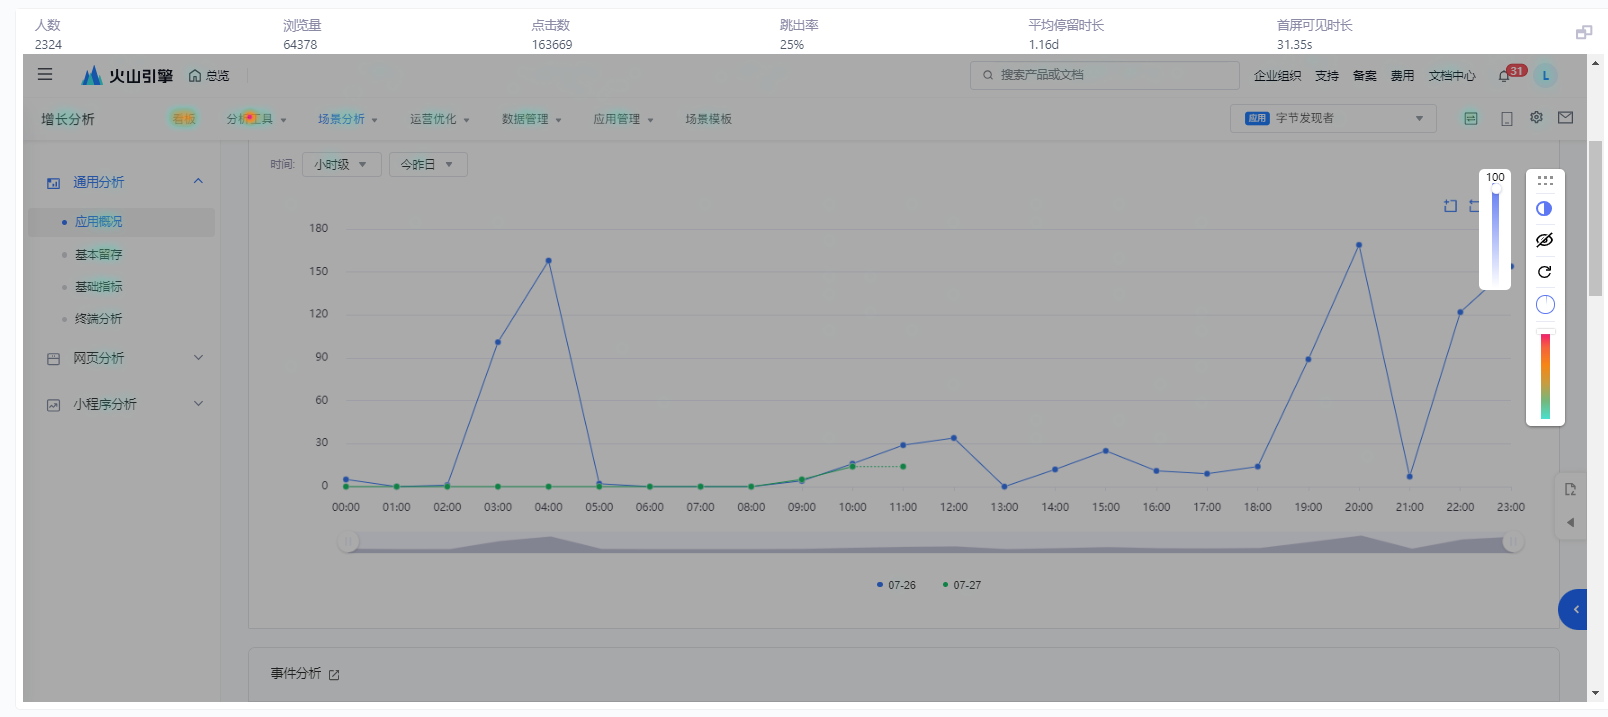
List page
The created merge page will appear in the heatmap list. In the card, you can learn some key indicators corresponding to the heat map yesterday and the past 7 days. If these indicators fluctuate wildly, you can enter the heatmap to select the corresponding date and further check whether there are any abnormal changes in clicks on the heatmap.
- Card indicator description:
- Page View: PV, shown in line chart.
- User: UV, shown in line chart.
- Clicks: The number of clicks (whether or not the link was clicked) on the page or group of pages used to render the heatmap.
- Bounce rate: The bounce rate of a page in this page or page group (when used as a landing page). The calculation method is: the number of bounces divided by the total number of visits, and the percentage display (the proportion of the number of sessions containing only one event to the total number of sessions);
- Average length of stay: The average length of stay for visitors.
- Date range description:
- The date of the single-value graph is: T-1;
- The single value graph ring ratio is: T-2;
- The date range of the trend chart is: T-7 (inclusive) to T-1 (inclusive).
Details page
Take the mobile end heat map as an example.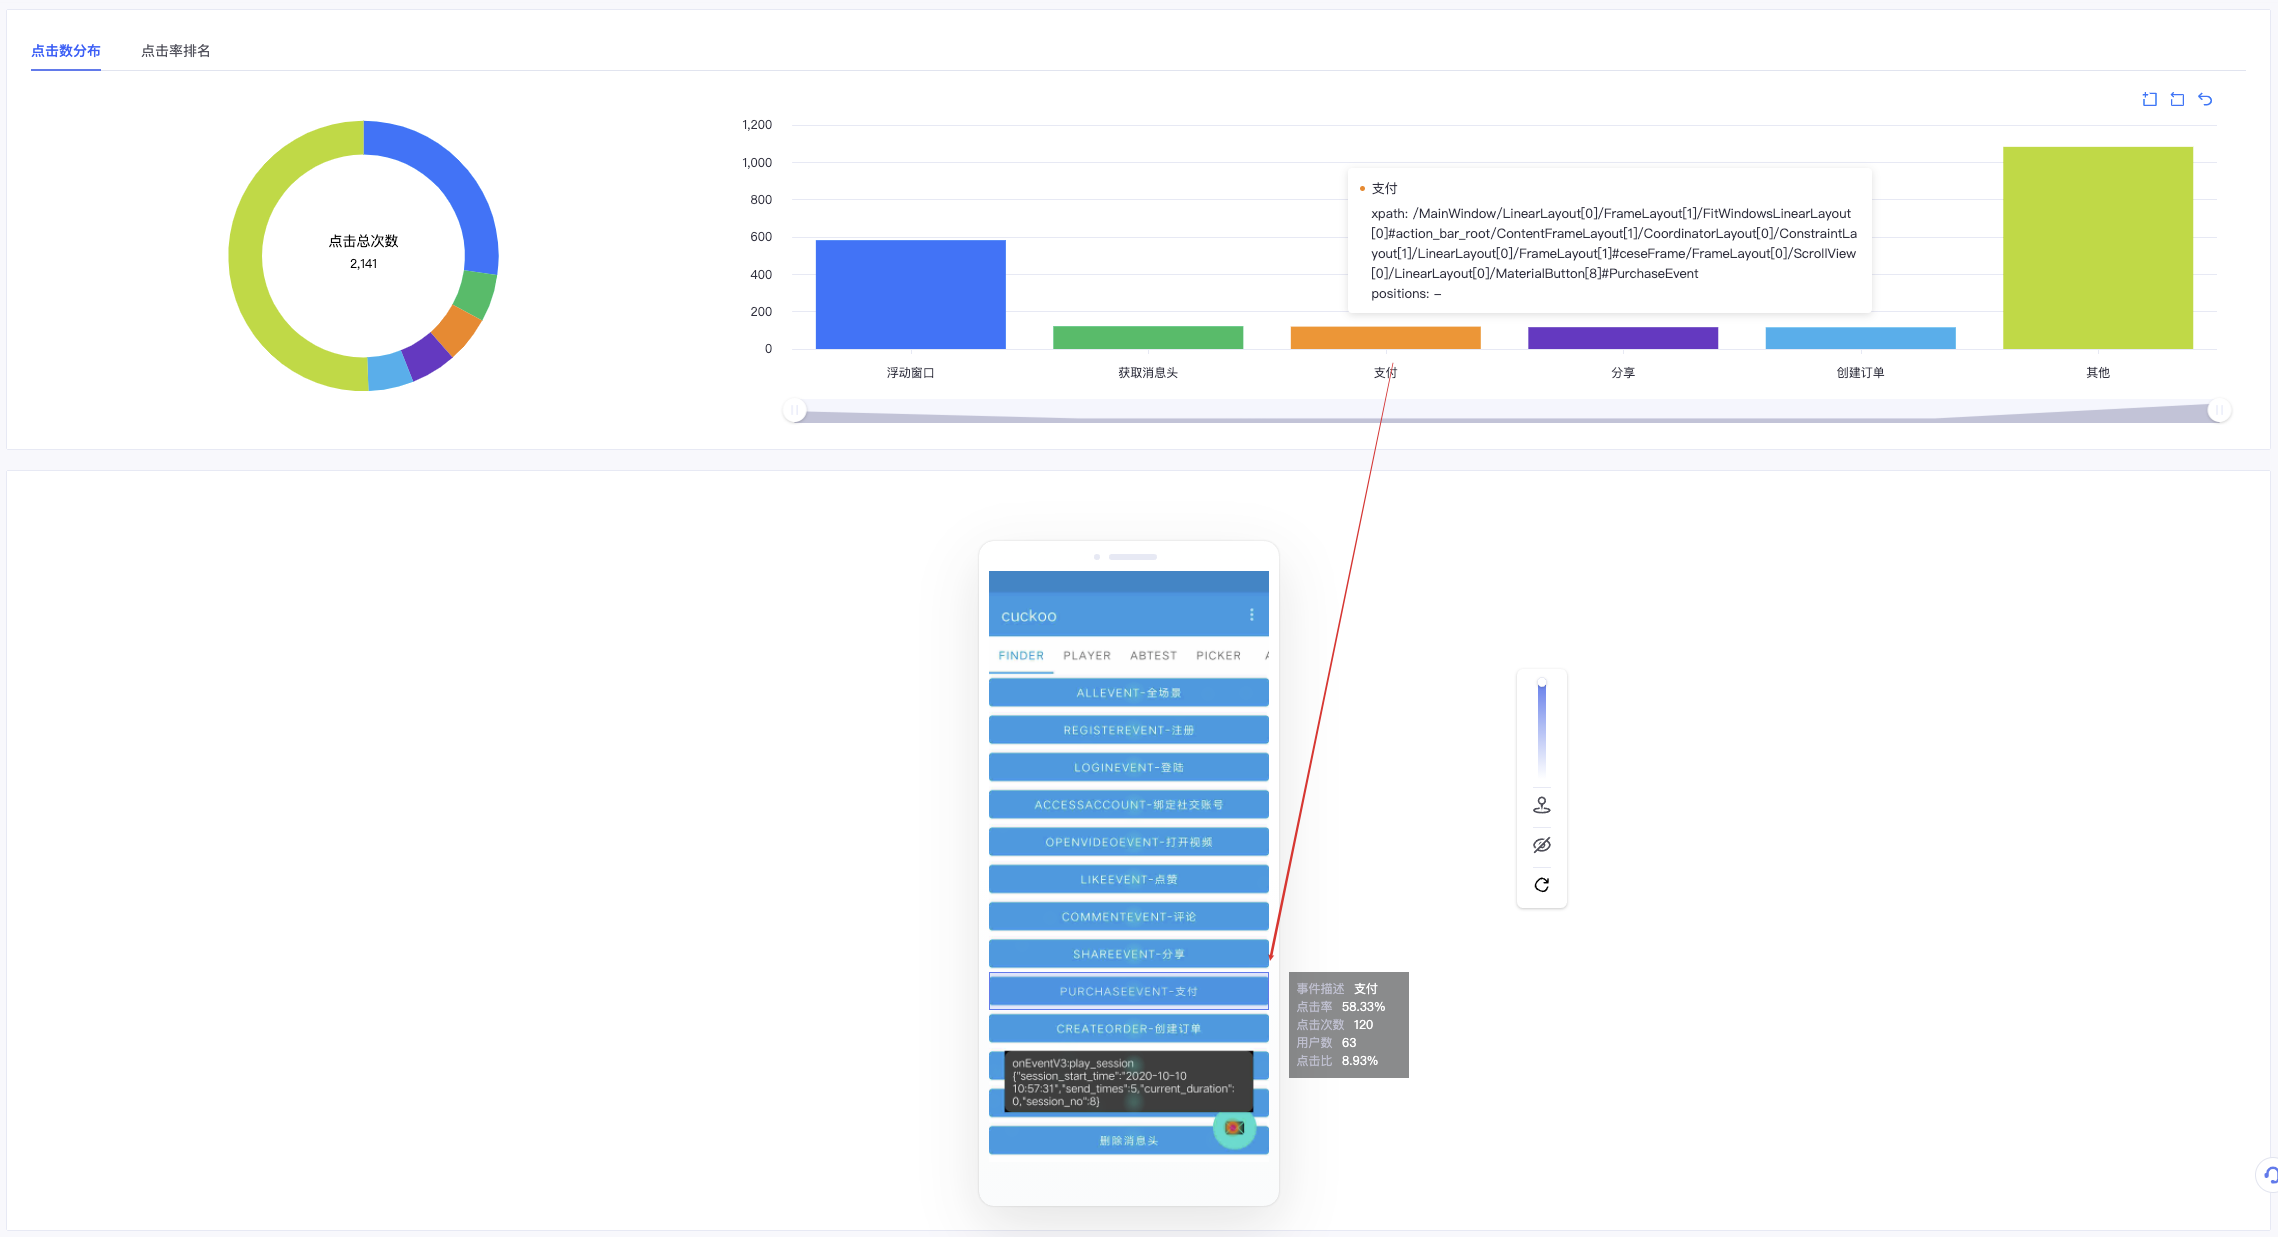
When viewing the heat map according to the click distribution, click on the bar chart, the corresponding position will be selected in the heat map below, and some basic information of the element will be seen through the prompt box, such as: click through rate, click number, number of users and click ratio.
- Event description: A defined event description, displaying "undefined" if the element is undefined, and displaying the name of the circled event if the element has been circled as an event.
- Click through rate: the number of clicks on the current element/the number of people entering the current page, percentage display.
- Clicks: The number of times the current element was clicked within the time frame.
- Number of users: The number of people (using SSID as the caliber) who clicked on the current element in the time frame.
- Click ratio: the number of clicks on the current element/the number of clicks on all visible elements in the current area, as a percentage.
Toolbar
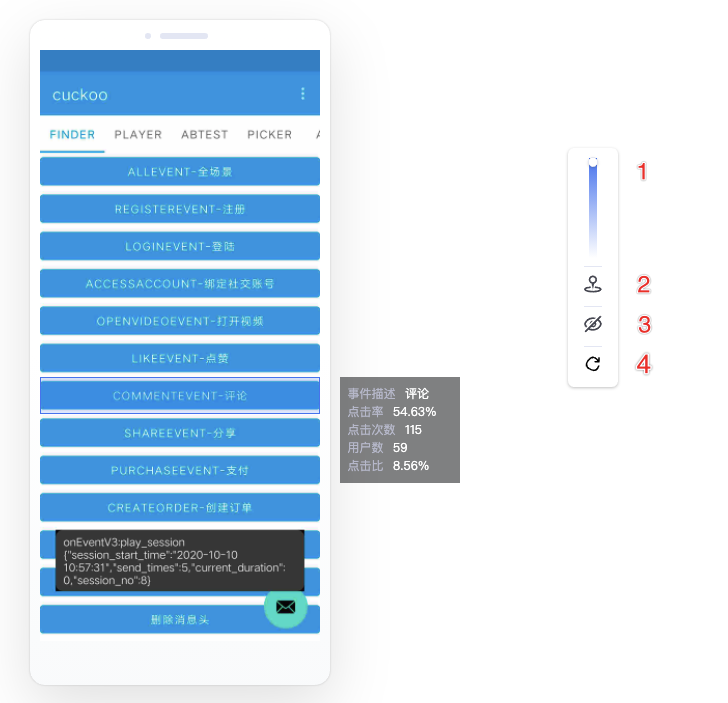
- Adjust the transparency of the heat map. If the heat map obscures the content of the original interface, you can adjust the transparency of the heat map to view the obscured content.
- Display all clickable elements simultaneously.
- Hide the heat map.
- Refresh the heat map.
Q1 When using the webpage heatmap, it was found that the created heatmap could not be loaded.
There are two main scenarios that can cause the heat map to fail to load within the product. They are:
- The page is not allowed to be embedded in an iframe.
- The page will automatically jump, causing the URL to change. It is common for WAP sites to jump to non-WAP URLs in desktop browsers.
In both cases, we currently provide the "Open on original page" function.
Clicking "Open on the original page" in the upper right corner of the heatmap will open the target page in a new window, and the heatmap will be rendered directly on the target page. For the first case of "not allowed to be embedded in iframes" above, it can be viewed directly on the original page.
For the second type, it is also necessary to switch the device type function through the browser, and simulate the desktop browser as a mobile browser to solve the problem. The specific operation steps are as follows:
- Click "Open on the original page" in the heat map details page;
- In the newly opened page, open the browser's "developer tools" function (cmd + opt + i, or f12);
- Change the device type to mobile phone.
- Enter the address of the target page (before the jump) in the browser address bar.
Q2 Why can't some elements see the heat map?
In the JS SDK, SVG elements are not collected by default. If you need to see a finer heat map distribution, you can consider opening svg collection. Please refer to the documentation: configuration parameter description.
