托管 Prometheus
托管 Prometheus


文档指南

请输入


- 文档首页
 托管 Prometheus接入指南Exporter 接入ElasticSearch Exporter 接入
 复制全文
复制全文 下载 pdf
ElasticSearch Exporter 接入
 文档反馈
文档反馈 问问助手
问问助手托管 Prometheus 服务提供基于 exporter 的方式来监控 ElasticSearch 的运行状态,本文为您介绍如何在集群中部署 elasticsearch-exporter,实现对 ElasticSearch 的监控。
前提条件
- 托管 Prometheus
- 已创建托管 Prometheus 工作区,详情请参见 创建工作区。
- 容器服务
- 已注册并开通容器服务(VKE)。
- VKE 集群已接入托管 Prometheus,详情请参见 容器服务接入。
- 已部署 Grafana 并接入工作区。
配置步骤
步骤一:使用 Secret 配置 Elasticsearch 连接串
- 登录 容器服务控制台。
- 单击左侧导航栏中的 集群。
- 在集群列表页面,单击需要配置的目标集群。
- 在集群管理页面的左侧导航栏中,选择 配置管理 > 保密字典,单击 使用 Yaml 创建,配置保密字典。
apiVersion: v1
kind: Secret
metadata:
name: es-secret-demo # 配置保密字典的名称
namespace: volcano-metrics # 配置保密字典的命名空间
type: Opaque
stringData:
esURI: <proto>://<user>:<password>@<es-address>:<port> # 配置对应 ES 的链接,包括用户名、密码、地址和端口号
步骤二:部署 elasticsearch-exporter
- 在左侧菜单栏中选择 工作负载 > 无状态负载。
- 单击 使用 Yaml 创建 ,部署 elasticsearch-exporter。
apiVersion: apps/v1
kind: Deployment
metadata:
name: es-exporter # 配置 exporter 的名称
namespace: volcano-metrics # 配置 exporter 的命名空间
labels:
app-name: es-exporter # 配置 exporter 的标签
spec:
replicas: 1 # 配置 exporter 副本数
selector:
matchLabels:
app-name: es-exporter # 根据业务需要调整成对应的名称,建议加上 ES 实例的信息
template:
metadata:
labels:
app-name: es-exporter # 根据业务需要调整成对应的名称,建议加上 ES 实例的信息
spec:
containers:
- env:
- name: ES-URI # 使用 Secret 配置 ElasticSearch 实例的地址信息
valueFrom:
secretKeyRef:
name: es-secret-demo
key: esURI
- name: ES-ALL # 配置是否采集 ElasticSearch 的所有监控项
value: "ture"
image: bitnami/elasticsearch-exporter:latest # 拉取 Docker Hub 中的 exporter 镜像
imagePullPolicy: IfNotPresent
name: es-exporter # 配置容器名称
ports:
- containerPort: 9114 # 配置容器端口号
name: metric-port # 配置容器端口名称
dnsPolicy: ClusterFirst
restartPolicy: Always
terminationGracePeriodSeconds: 30
说明
步骤三:配置采集规则
- 在左侧菜单栏中选择 工作负载 > 对象浏览器。
- 单击 使用 Yaml 创建 ,通过 PodMonitor 配置采集规则。
- 在 类型 下拉菜单中选择 自定义。
- 在 Yaml 配置框内输入 Yaml 配置。
apiVersion: monitoring.coreos.com/v1
kind: PodMonitor
metadata:
name: es-exporter # 配置 PodMonitor 的名称
namespace: volcano-metrics # 配置 PodMonitor 的命名空间
labels:
volcengine.vmp: "true" # 配置 PodMonitor 的标签,允许被 Prometheus-agent 发现
spec:
podMetricsEndpoints:
- interval: 30s
port: metric-port # 填写 exporter 的容器端口名称
path: /metrics # 填写指标暴露的 URI 路径,不填默认为 /metrics
relabelings: # 配置指标的 relabel。如没有需求。可省略。
- action: replace
sourceLabels:
- instance
regex: (.*)
targetLabel: instance
replacement: 'ES-xxxxxx' # 配置为 ES 实例的 ID 值
namespaceSelector:
matchNames:
- volcano-metrics # 配置为 exporter 的命名空间
selector:
matchLabels:
app-name: es-exporter # 配置 exporter 的 Label 值,以定位目标 Pod
结果验证
- 执行以下命令,配置 Grafana 端口映射。
kubectl port-forward service/grafana 3000:3000 -n volcano-metrics
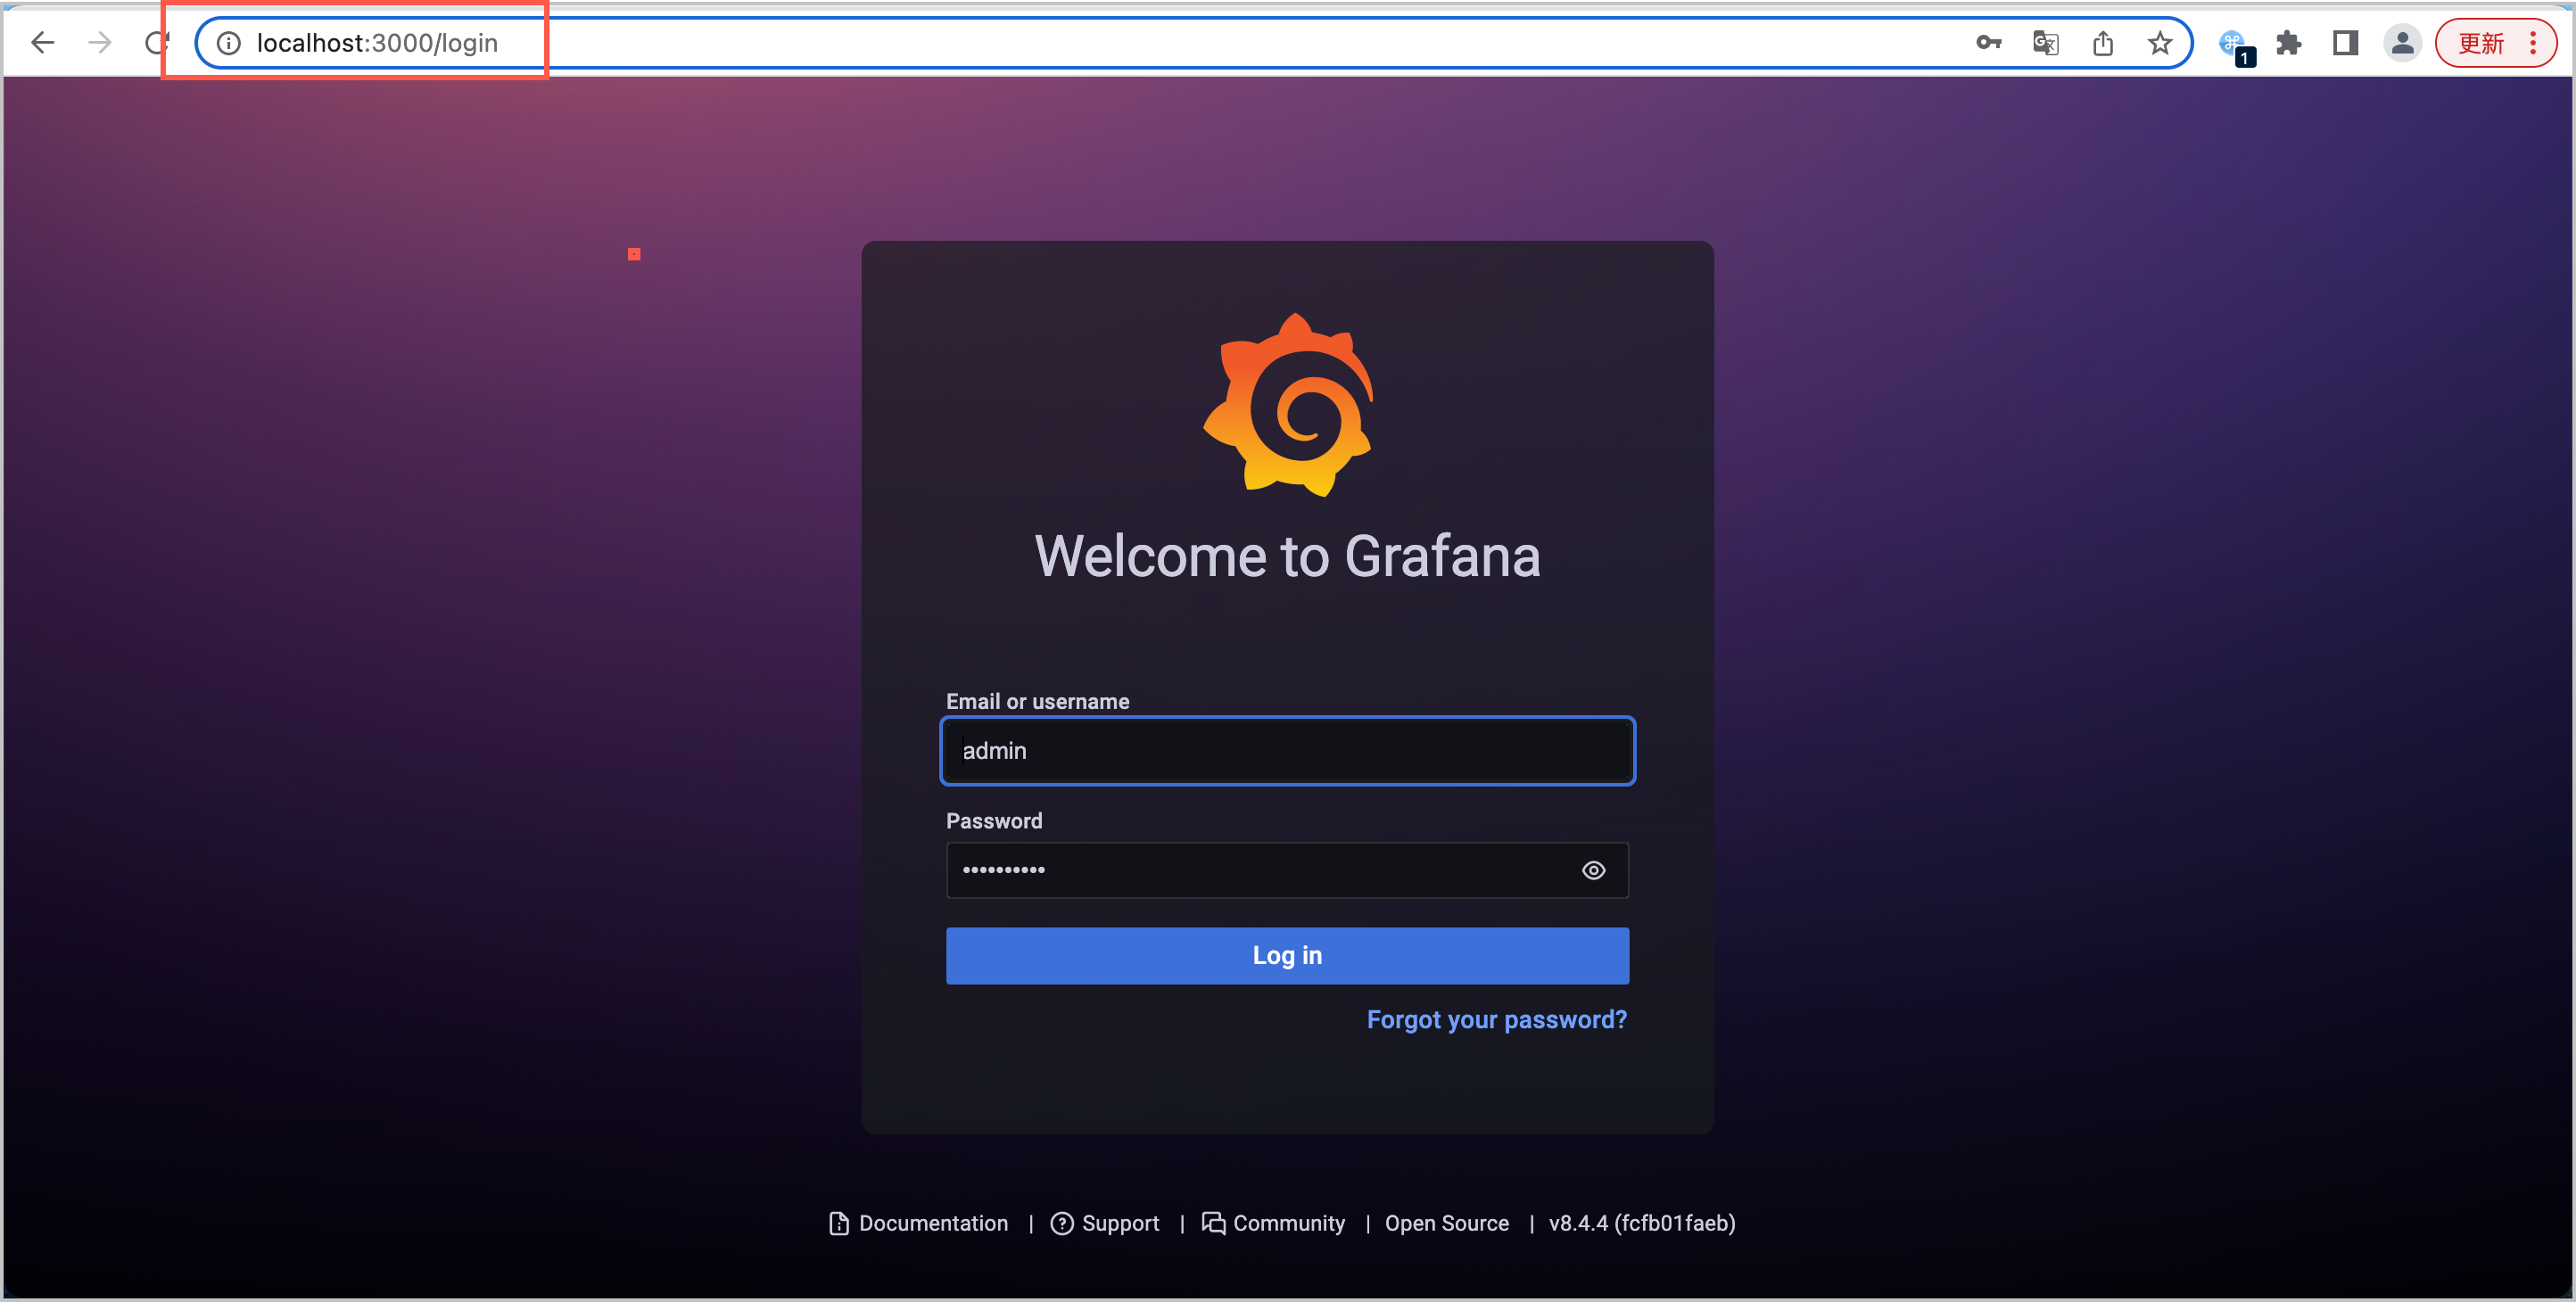
- 在本地环境(Linux/Mac)中打开浏览器,在地址栏中输入 localhost:3000,进入 Grafana 登录界面,使用默认用户名admin密码admin登录。
-
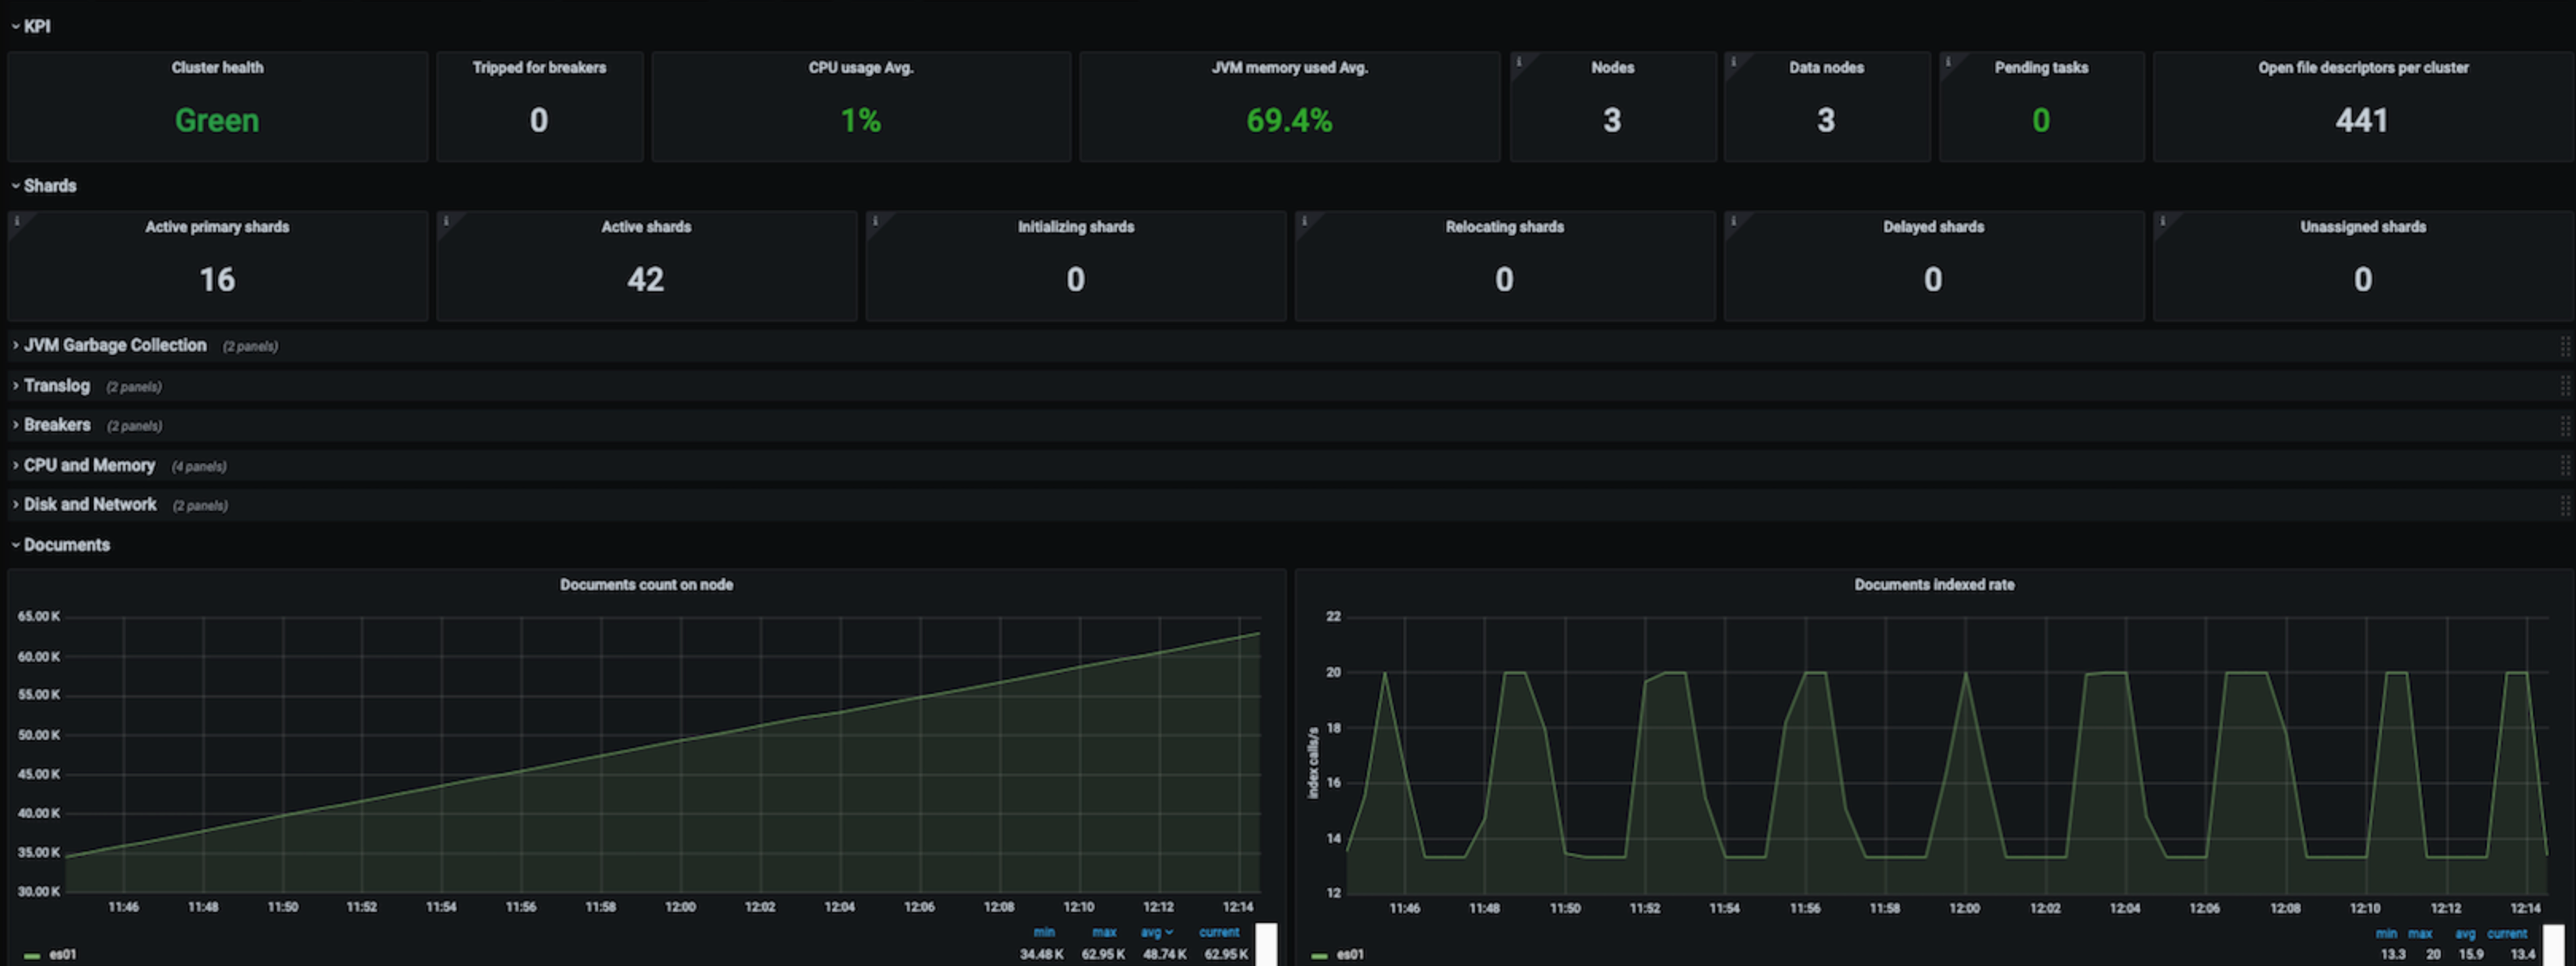
- 登录 Grafana 后,创建大盘,即可查看 ElasticSearch 的指标信息。
-
说明
最近更新时间:2025.12.15 11:41:42
这个页面对您有帮助吗?
有用
有用
无用
无用