Torch Object Storage
Torch Object Storage
Torch Object Storage


Document
What's New
Announcements
Billing
Billable items
Billing method
Getting Started
User Guide
Working with buckets
Basic configurations
Managing lifecycle
Back-to-origin rules
Event notification
Intelligent Tiering
Domain management
Fault tolerance and disaster recovery
Cross-region replication
Same-region replication
Data redundancy
Image processing
ObjectSet
Working with objects
Managing folders
Monitoring and alerting
Metric monitoring
Access control
Bucket policies
Common configuration scenarios
Authorizing IAM users of the current account
Authorizing other accounts
Managing access via tools and SDKs
Managing public read access
Data security
Access points
Multi-region access points (MRAP)
Single-region access points (SRAP)
Converged access points (CAP)
DevMind
TOS accelerator
SenseFlow
TOS Agent
Data processing
Basic concepts
Image processing
Media processing
Document preview
Task processing
Data subscription
Flow control management
Quality of Service (QoS) policies
Hierarchical namespace (HNS)
User guide
Tool reference
Best practices
TOS Vectors
User guide
API reference
Vector bucket
Vector index
SDK reference
Python-Vectors
Vector bucket
Vector index
Java-Vectors
Vector bucket
Vector index
Node.js-Vectors
Vector bucket
Vector index
Tool Guide
tosutil
Common commands
Upload, download, and copy objects
Share objects
Auxiliary commands
Common examples
TOS Browser
FSX
FSX best practices
TOS PyTorch Connector
tosfsspec
TOS Import(will be deprecated soon)
API Reference
Signature Mechanism
The header contains a signature
Bucket
Basic Bucket Operations
Bucket Lifecycle
Access Monitor
Bucket ACL
Bucket CORS
Bucket Policy
Back-to-origin Rules
Bucket Replication
Versioning
Static Website
Event Notification
Custom Domain
Server-side encryption
Transfer Acceleration
Data Processing
Image processing
Media processing
Video transcoding
Audio transcoding
video to GIF
Document preview
File decompression
Log Storage
Retention Policy
Requester pays
TLS version
Object
Basic Object Operations
Object ACL
Fetch Object
Symbolic Link
WORM object
Multipart Upload
SDK Reference
Java
Pre-signing Mechanism
Bucket Interface
Basic Bucket Interface
Manage Bucket Configuration
Object Interface
Upload Object
Download Object
Upload and Download Speed Limit
Copy Object
List Object
Data Processing
Image Processing
Video Processing
Audio Processing
Log Configuration
Hierarchical Namespace
Bucket base interface
Introduction to Typical Scenes
Python
Data processing
Pre-signature mechanism
Bucket interface
Basic bucket interface
Manage bucket configuration
Object interface
Upload object
Download object
Copy object
List objects
Introduction to typical scenes
C
Object Interface
Upload object
C++
Pre-signature Mechanism
Bucket Interface
Basic Bucket Interface
Manage Bucket Configuration
Object Interface
Upload Object
Download Object
Copy Object
List Objects
Data Processing
Go
Object Interface
Upload Object
Download Object
Copy Object
List Objects
Manage Objects
Bucket Interface
Manage Bucket Configuration
Data Processing
Log Configuration
Introduction to Typical Scenes
Pre-signature Mechanism
Node.js
Pre-signature Mechanism
Bucket Interface
Basic Bucket Interface
Manage Bucket Configuration
Object Interface
Upload object
Download object
Copy object
List objects
Data Processing
Image Processing
Introduction to Typical Scenes
Browser.js
Pre-signature Mechanism
Upload Object
Download Object
Copy Object
List Objects
Manage Objects
Data Processing
.NET
Bucket Interface
Object Interface
Upload Object
Download Object
List Objects
Introduction to Typical Scenes
PHP
Bucket Interface
Object Interface
Download Object
Data Processing
Exception Handling
Android
Bucket Interface
Object Interface
Upload Object
Download Object
Exception Handling
iOS
Bucket Interface
Object Interface
Upload Object
Download Object
Harmony
Pre-signature Mechanism
Bucket Interface
Object Interface
Upload Object
Download Object
List Objects v2
Introduction to Typical Scenarios
Rust
Pre-signing mechanism
Bucket interface
Basic bucket operations
Lifecycle rules
Bucket ACLs
Cross-origin resource sharing
Bucket inventory
Back-to-origin rules
Bucket replication
Static website hosting
Event notification
Custom domain
Server-side encryption
Object interface
Basic operation
Access control
Error Codes
01-SERVICE_ERROR
02-AUTH
03-ACCESS_CONTROL
04-QOS
05-REQUEST
06-BUCKET
07-LIFECYCLE
08-ACL
09-CORS
10-POLICY
11-MIRROR
12-REPLICATION
13-WEBSITE
14-NOTIFICATION
15-ENCRYPT
16-CUSTOMDOMAIN
17-OBJECT
18-TAG
19-MULTIPART
20-STORAGE_CLASS
21-CALLBACK
22-DATA_PROCESS
23-BATCH
24-STORAGE_LENS
25-INVENTORY
26-DIRECTORY_BUCKET
FAQ
Best Practices
AIGC-Doubao LLMs
Accessing TOS with third-party tools
Granting temporary access
Data migration
Data processing
Checking data integrity
Performance optimization
- Documentation
 Torch Object StorageUser GuideDevMindStorage LensViewing Storage Lens dashboards
 Copy page
 Download PDF
Storage Lens
Viewing Storage Lens dashboards
Copy pageDownload PDFViewing Storage Lens dashboards
This topic explains how to view Storage Lens dashboard metrics.
How data is aggregated
Storage Lens dashboards aggregate storage data from your account daily across five levels of granularity. These dashboards provide snapshots, metric details, and trend and distribution views to help you analyze metrics such as storage usage, object count, and storage type from multiple angles.
Granularity | Description |
Overview | Includes Snapshot, Metric Details, Trends and Distribution, and Snapshot Top N modules. You can view combined data for a specified date, trends and distributions of combined data within a certain time range, top N overview, and growth of top N prefixes. |
Section | Includes Trend, Distribution, Bubble Chart and Data Details modules. You can view trends and distributions of data across regions over a specified time range, as well as combined data for each region on a given date. |
Storage type | Includes Trend, Distribution, Bubble Chart and Data Details modules. You can view trends and distributions of data across storage types over a specified time range, as well as combined data for each storage type on a given date. |
Bucket | Includes Trend, Distribution, Bubble Chart and Data Details modules. You can view trends and distributions of data across buckets over a specified time range, as well as combined data for each bucket on a given date. |
Prefix | Includes Trend, Distribution, Bubble Chart and Data Details modules. You can view trends and distributions of data across prefixes over a specified time range, as well as combined data for each prefix on a given date. tip This option is only available when advanced features is selected under Metric collection method and Prefix aggregation is enabled. |
Dashboard modules
Snapshot
Metric Details
Trends and Distribution
Snapshot Top N
Bubble Chart
Data Details
Top N Prefix Growth
This module provides a static overview of your storage resources on a given date. It shows four core metrics: total storage, object count, average object size, and bucket count. This allows you to quickly assess the overall scale of your resources for that day.

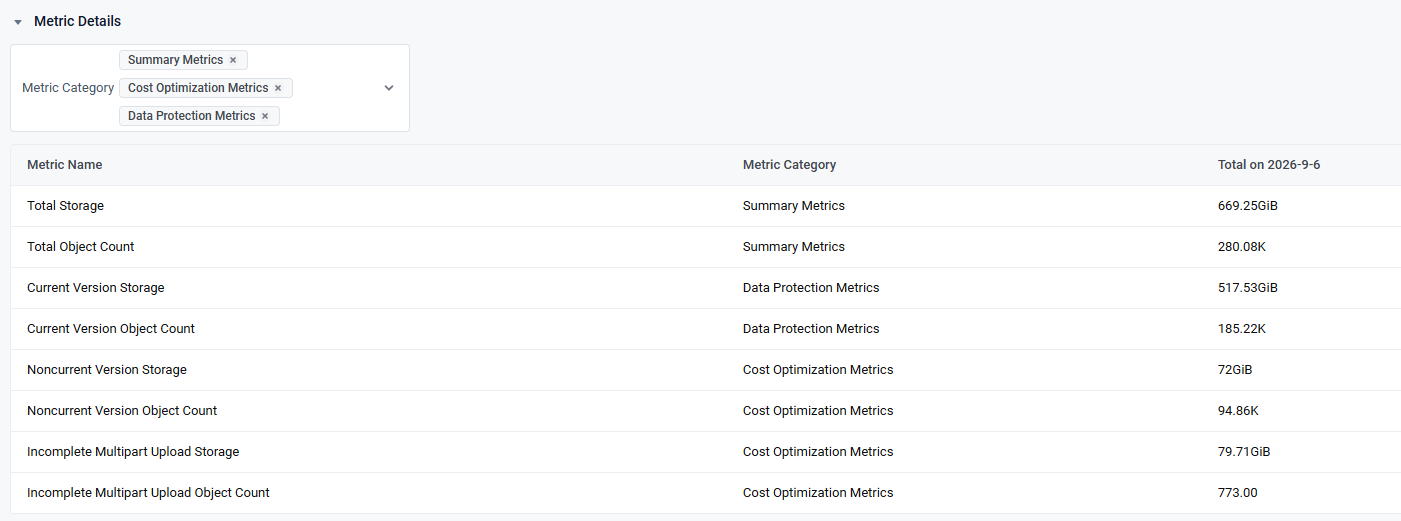
The metric filter in this module allows you to quickly view detailed metric values for each category (Summary, Cost Optimization, and Data Protection) on the selected date. The details for each category are as follows:
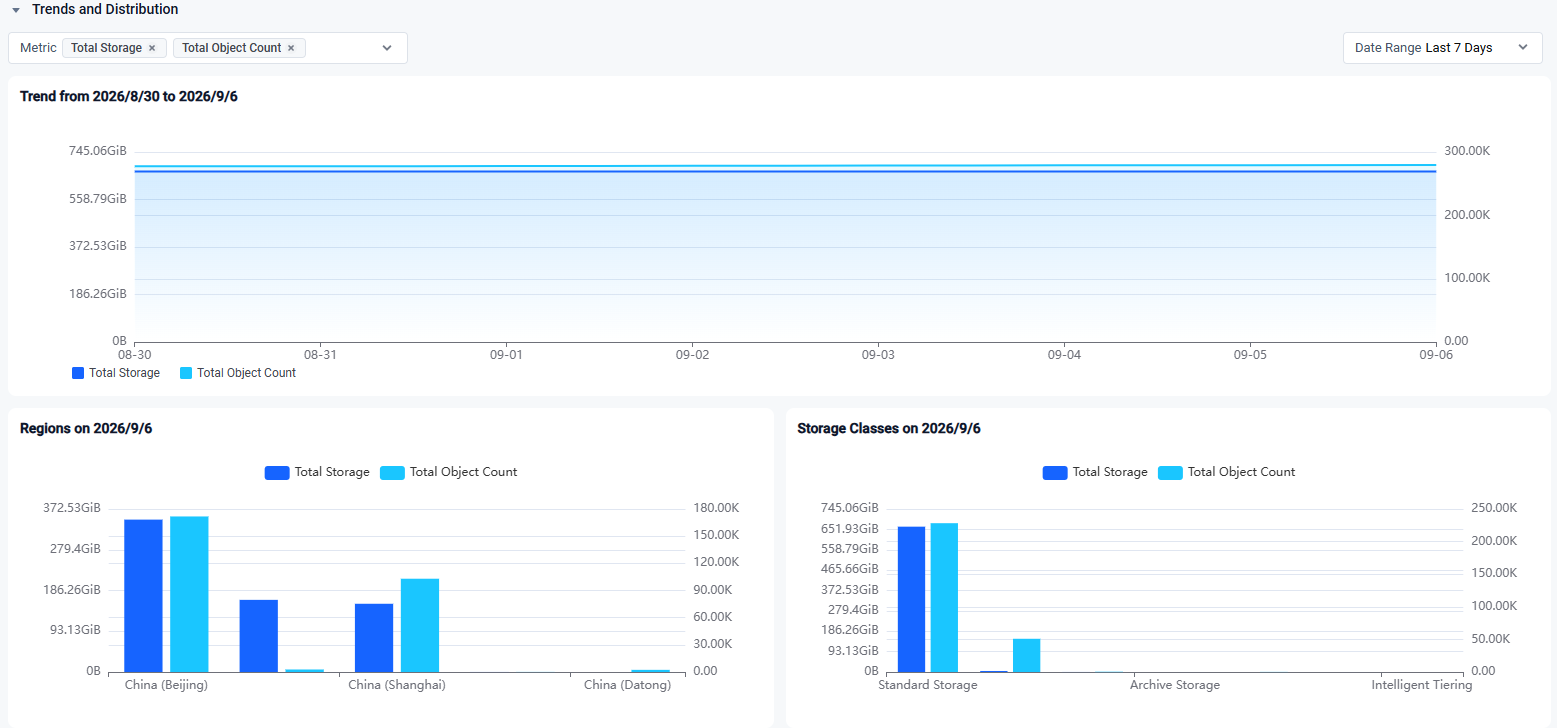
This module focuses on one or more specific metrics, combining a trend chart with distribution views by region and storage type. This allows you to track changes to the metrics over time and analyze the composition by region and storage type. You can also export detailed data on total storage, data uploaded, and data deleted. The module consists of the following sections:
Section | Time range | Content |
Trend | The date range selected in the Trends and Distribution section (default: 7 days) | A continuous daily trend of the selected metric(s), which helps you identify growth patterns, fluctuations, and anomalies. |
Regions | The selected date | The proportional and absolute values of the selected metric(s) across regions. |
Storage classes | The selected date | The proportion of the selected metric(s) across storage types such as Standard Storage, Infrequent Access Storage, and Archive. |
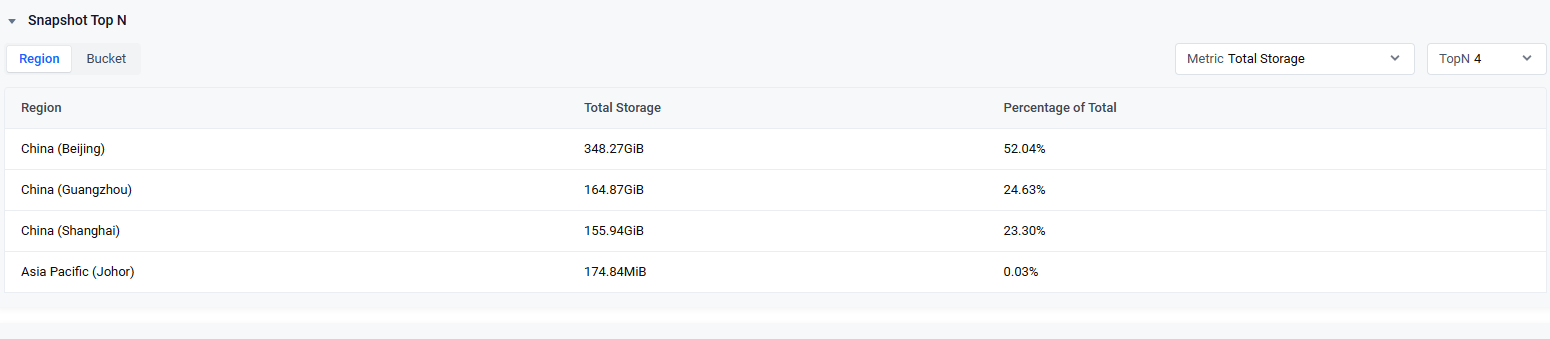
This module displays the top N items for a specified metric on a given date, sorted by prefix, region, or bucket. It helps you quickly identify the objects that contributed the most to that day. The module consists of the following sections:
Section | Description |
Switch dimension | Sort the items by selecting Prefix, Region, or Bucket. Click the corresponding tab to change the view. tip The Prefix view is only available when advanced features is selected under Metric collection method and Prefix aggregation is enabled. |
Metric | Select the metric for which you want to see a ranking. You can choose from the following categories: summary, cost optimization, and data protection. |
TopN | Specify the value for N. The larger the number, the more entries will be displayed. The current maximum is 100. |
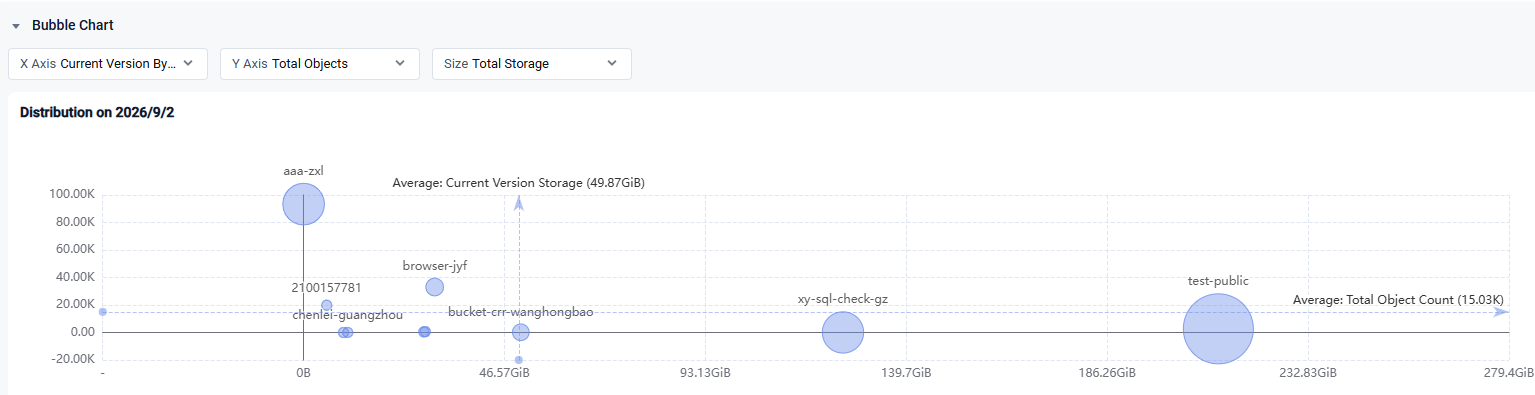
To display the overall data distribution and aggregation for a selected date, configure the following: X Axis, Y Axis, and Size.
This module displays a table with the full set of metrics for the selected dimension (region, storage type, bucket, or prefix) and metric category, based on the chosen date.
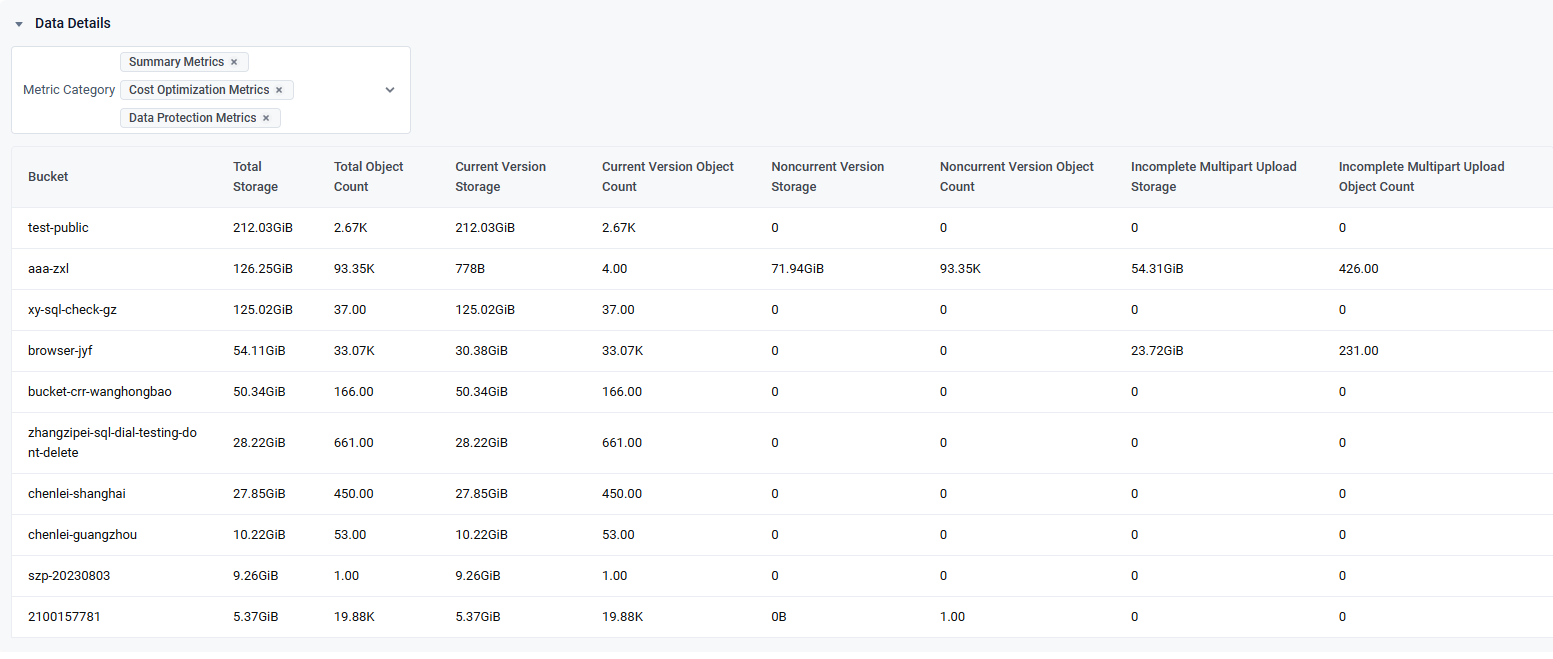
This module displays the fastest-growing prefixes (directories) on a specified base date and their month-to-month changes. This helps you quickly identify directories that are expanding rapidly for storage capacity attribution and management.
tip
This module is only available when advanced features is selected under Metric collection method and Prefix aggregation is enabled.
Last updated: 2026.09.10 18:05:40
All rights reserved © Beijing Volcano Engine Technology Co., Ltd2024
