Elastic Compute Service
Elastic Compute Service


Document

- Documentation
 Elastic Compute ServiceElastic Compute ServiceBest PracticesPerformance testUsing Sysbench to test MySQL application performance
 Copy page
 Download PDF
Performance test
Using Sysbench to test MySQL application performance
Copy pageDownload PDFUsing Sysbench to test MySQL application performance
This topic describes how to use Sysbench to test MySQL application performance of ECS instances.
Background
- MySQL overview
- MySQL is a Relational Database Management System (RDBMS) and uses SQL, the most common Structured Query Language, for database management. In web application scenarios, when web applications are under high load, MySQL has high requirements for virtual machine performance, including the performance of CPU computing capacity, network, and storage. As a result, MySQL is often used to test the overall performance of a virtual machine.
- Sysbench
- Sysbench is a modular, cross-platform, open-source multi-threaded benchmarking tool. You can use it to test the performance of databases, CPU, memory, threads, and IO. Typically, it is used to test database loads under different system parameters. For detailed instructions, refer to Using Sysbench to test ECS instance performance.
Test metrics
- TPS (Transactions Per Second): The number of transactions the database executes per second.
- QPS (Queries Per Second): The number of queries received per second. This refers to the number of SQL statements the database executes per second (including INSERT, SELECT, UPDATE, and DELETE).
Software versions
- MySQL/MariaDB: In the example provided in this topic, MariaDB 10.6.12 is used.
- Sysbench: In the example provided in this topic, Sysbench 1.0.19 is used.
Test environment
Two ECS instances with the same specifications are used as the Server and Client, respectively. The specific configuration is shown in the table below.
Sample configuration | Server | Client |
Instance specifications | ecs.g3i.2xlarge | ecs.g3i.2xlarge |
Image type | Ubuntu 22.04 | Ubuntu 22.04 |
Data volume specification | Data volume: 1000GiB * 1 | - |
Instance quantity | 1 | 1 |
Refer to the table below to optimize configurations for the Server and the Client (perform optimization for the Client as needed) for optimal MySQL application performance.
Optimization item | Configuration details |
Partition volume | We recommend that when you partition a volume, set the starting cylinder value to ≥ 2048 and a multiple of 8. For detailed operations, refer to Partitioning and formatting volumes. tip In the example provided in this topic, the volume is partitioned and mounted to the file system in Step 1. You can skip this step. |
Install irqbalance-ng | Follow the guide in network interface interrupt binding to install irqbalance-ng, which automatically configures interrupts for physical network interfaces. This helps enhance network performance. |
Disable napi_tx | This feature is enabled by default only when the Linux kernel version is ≥ 5.3. You can execute the uname -r command to check the kernel version, and then disable napi_tx as follows.
# Disable napi_tx: rmmod virtio_net && modprobe virtio_net napi_tx=0 && systemctl restart systemd-networkd.service # Enable napi_tx: rmmod virtio_net && modprobe virtio_net napi_tx=1 && systemctl restart systemd-networkd.service
# Disable napi_tx: rmmod virtio_net && modprobe virtio_net napi_tx=0 && systemctl restart networking.service # Enable napi_tx: rmmod virtio_net && modprobe virtio_net napi_tx=1 && systemctl restart networking.service
# Disable napi_tx: rmmod virtio_net && modprobe virtio_net napi_tx=0 && systemctl restart nmcli c reload # Enable napi_tx: rmmod virtio_net && modprobe virtio_net napi_tx=1 && systemctl restart nmcli c reload Execute the cat /sys/module/virtio_net/parameters/napi_tx command. If N is returned, napi_tx is disabled.  |
Procedure
tip
- Test results provided in this topic are for reference only and do not represent the actual optimal performance of an ECS instance.
- To avoid data loss, we recommend running performance tests on a newly created, data-free instance with the guidance provided in this topic.
Step 1: Deploy MySQL application on the Server
- Execute the following command to create the install_mysql.sh script.
- vim install_mysql.sh
- Press i key to enter edit mode, and then enter the content of the following file.
This file is used to install the MySQL application, partition the volume, mount the volume to a file system, and specify the MySQL persistent storage path on this file system.
- Press the Esc key to exit edit mode, enter :wq, and then press Enter to save and exit the file.
- Execute the following commands to run the script.
- bash install_mysql.sh >> install_mysql.log
Step 2: Install Sysbench on the Client and create test scripts
- Install Sysbench.
- Execute the following command to create the install_sysbench.sh file.
- vim install_sysbench.sh
- Press i key to enter edit mode, and then enter the following content.
- #!/bin/bashif which apt;thenapt updateapt-get install -y automake libtool pkg-config default-libmysqlclient-dev:amd64 elif which yum;thenyum install -y libtool mysql-devel automakefiwget https://github.com/akopytov/sysbench/archive/1.0.19/sysbench-1.0.19.tar.gztar xzvf sysbench-1.0.19.tar.gzcd sysbench-1.0.19/./autogen.sh./configure --with-mysqlmake -j8make install
- Press the Esc key to exit edit mode, enter :wq, and then press Enter to save and exit the file.
- Execute the following command to install Sysbench.
- bash install_sysbench.sh
- Create the runtime script mysql_test_run.sh for testing.
- Execute the following command to create a runtime script for testing.
- vim mysql_test_run.sh
- Press i key to enter edit mode, and then enter the following content. Do not execute this script at this time.
- #!/bin/bashdest_host=$serverIPthread_count=128VIRT_BENCHMARCK_TARGET=/usr/localVIRT_BENCHMARCK_OUTPUT=$(pwd)echo "------------------------------------------------"dateecho "BENCHMARK PREPARE sysbench mysql ${dest_host} ${thread_count}"for MYSQLTEST in oltp_read_only oltp_write_onlydo$VIRT_BENCHMARCK_TARGET/bin/sysbench --mysql-host=${dest_host} --mysql-port=3306 --mysql-user=sbtest --mysql-password=sbpasswd $VIRT_BENCHMARCK_TARGET/share/sysbench/oltp_common.lua --tables=10 --table_size=100000 prepare > $VIRT_BENCHMARCK_OUTPUT/oltp_prepare.logecho "------------------------------------------------"echo "BENCHMARK STATR [$MYSQLTEST] ${dest_host} ${thread_count}"$VIRT_BENCHMARCK_TARGET/bin/sysbench --threads=${thread_count} --time=120 --report-interval=1 --mysql-host=${dest_host} --mysql-port=3306 --mysql-user=sbtest --mysql-password=sbpasswd $VIRT_BENCHMARCK_TARGET/share/sysbench/$MYSQLTEST.lua --tables=10 --table_size=100000 run > $VIRT_BENCHMARCK_OUTPUT/$MYSQLTEST.logecho "BENCHMARK RESULT [$MYSQLTEST] ${dest_host} ${thread_count}"grep -E "transactions:|queries:" $VIRT_BENCHMARCK_OUTPUT/$MYSQLTEST.log$VIRT_BENCHMARCK_TARGET/bin/sysbench --mysql-host=${dest_host} --mysql-port=3306 --mysql-user=sbtest --mysql-password=sbpasswd $VIRT_BENCHMARCK_TARGET/share/sysbench/oltp_common.lua --tables=10 --table_size=100000 cleanup > $VIRT_BENCHMARCK_OUTPUT/oltp_cleanup.logsleep 300s # Avoid MySQL's WAL mechanism affecting QPS testdone
- Press the Esc key to exit edit mode, enter :wq, and then press Enter to save and exit the file.
- Create the script mysql_test_result.sh to obtain the test result.
- Execute the following command to create a script to obtain the result.
- vim mysql_test_result.sh
- Press i key to enter edit mode, and then enter the following content. Do not execute this script at this time.
- #!/bin/bashVIRT_BENCHMARCK_OUTPUT=$(pwd)write_tps=$(grep -E "transactions:" $VIRT_BENCHMARCK_OUTPUT/oltp_write_only.log |awk '{print $3}')read_qps=$(grep -E "queries:" $VIRT_BENCHMARCK_OUTPUT/oltp_read_only.log |awk '{print $3}')echo "{\"mysql_write_tps\":"${write_tps:1}",\"mysql_read_qps\":"${read_qps:1}"}"
- Press the Esc key to exit edit mode, enter :wq, and then press Enter to save and exit the file.
Step 3: Execute the test script on the Client and obtain the result
- Obtain the private IP address of the Server, log in to the Client, and then execute the following command to run the test.
To obtain the private IP address of the Server, go to the Instances page in the ECS console, and then view it in the "Primary IPv4 address" column.
- serverIP=192.168.x.xx bash mysql_test_result.sh
- After the execution, execute the following command to obtain the test result.
- bash mysql_test_result.sh
- The output is shown below. "mysql_write_tps" indicates the TPS metric of MySQL in this test, and "mysql_read_qps" indicates the QPS metric of MySQL.
-

- After the test on the Client is completed, you can execute the following commands for detailed test results.
- View QPS metric: cat oltp_read_only.log
- View TPS metric: cat oltp_write_only.log
- In the example provided in this topic, oltp_read_only (QPS) is used. Below are the relevant metric descriptions.
-
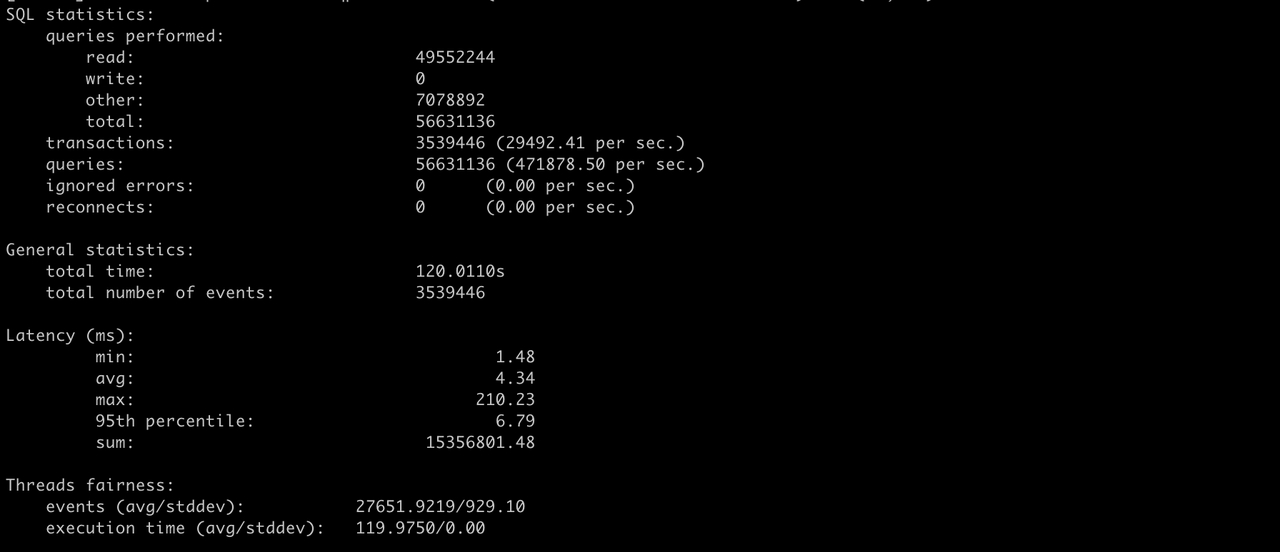
- SQL statistics:queries performed:read: 49552244 // Total number of read requests executed, such as SELECT operationswrite: 0 // Total number of write requests executed, such as UPDATE, INSERT, and DELETE operationsother: 7078892 // Total number of other requests executed, such as CREATE, DROP, and COMMIT operationstotal: 56631136 // Total number of all requests executedtransactions: 3539446 (29492.41 per sec.) // The former represents the total number of completed transactions, and the latter represents TPS (Transactions Per Second)queries: 56631136 (471878.50 per sec.) // The former represents the total number of completed queries, and the latter represents QPS (Queries Per Second)ignored errors: 0 (0.00 per sec.) // Number of errors that occurred and have been ignoredreconnects: 0 (0.00 per sec.) // Number of request reconnection attemptsGeneral statistics:total time: 120.0110s // Test durationtotal number of events: 3539446 // Total number of events completedLatency (ms):min: 1.48 // Represents the shortest time taken to complete one eventavg: 4.34 // Represents the average time taken to complete all eventsmax: 210.23 // Represents the longest time taken to complete one event95th percentile: 6.79 // Represents the time within which 95% of events were completedsum: 15356801.48 // Represents the total time spent by all threads during the testThreads fairness:events (avg/stddev): 27651.9219/929.10 // The former represents the average number of events completed per thread, and the latter represents the standard deviationexecution time (avg/stddev): 119.9750/0.00 // The former represents the average execution time per thread, and the latter represents the standard deviation
Last updated: 2026.06.18 17:49:49
All rights reserved © Beijing Volcano Engine Technology Co., Ltd2024
