Intelligent Data Insight
Intelligent Data Insight


- Documentation
 Intelligent Data InsightDataWind User GuideDashboard Construction and ViewingInteraction AnalysisIntelligent Attribution
 Copy page
 Download PDFCopy pageDownload PDF
Intelligent attribution refers to the attribution analysis feature built into the visualization dashboard, which uses embedded attribution algorithms to help users gain insights into the causes of business anomalies. Through multidimensional attribution analysis, it enables in-depth examination of data results, identification of influencing factors and root causes of metrics, and gain intelligent attribution insights. This article introduces how to use the intelligent attribution feature.
Intelligent attribution is only available for extracted datasets and does not currently support live datasets. For the differences between live and extracted datasets, refer to Connection methods.
Over time, users often observe significant increases or sharp decreases in values and want to understand the reasons behind such fluctuations. With intelligent attribution, the reasons can be identified with just a few clicks. Specific business scenario examples are as follows. The actual results depend on your business data.
Attribution analysis for sudden increase in average latency
Through attribution analysis, it can be found that the increase in latency may be caused by the Rexxx project.
Attribution analysis for sudden increase in payment amount
Through attribution analysis, it is found that the sudden increase is mainly due to growth in the Beijing region.
The basic trigger conditions for attribution analysis are as follows:
- The X-axis must be a date-type field. Currently, the supported aggregation granularities are day, week, and month.
- There must be at least one metric in the chart that meets the expression requirements. For details, see the supported expressions for attribution analysis described later in this article.
- The current analysis point or comparison time point must not be empty, null, or 0.
- The dataset used for attribution analysis must be an extracted dataset; live datasets are not currently supported.
warning
Attribution analysis requires a certain amount of continuous data; otherwise, fluctuation status cannot be determined.
- Day level: At least 14 consecutive days of data are required.
- Week level: At least 8 consecutive weeks of data are required.
- Month level: At least 24 consecutive months of data are required.
- In the line chart, when a sudden drop in GMV is observed on the most recent day, click the data point showing the decrease to perform attribution analysis (select "Default Attribution Analysis" here).
- After the attribution analysis calculation is complete, click to view the attribution results.
- View the attribution results. Recently, GMV has shown abnormal fluctuations. By default, the data is compared with the previous month, showing a decrease of 22.61%. The dimensions are ranked according to their contribution to the decline, and it is found that the coefficient of sale_city is 0.56, making it a significant influencing factor. You can filter and further analyze the sales performance of this region.
Comparison time selection for attribution analysis
- Default attribution analysis
- Day-level: By default, the date 7 days ago is compared with the current date
- Week-level: By default, the previous week is compared with the current week
- Month-level: By default, the previous month is compared with the current month
- Custom comparison time: You can customize the comparison time
Interpret the attribution analysis report
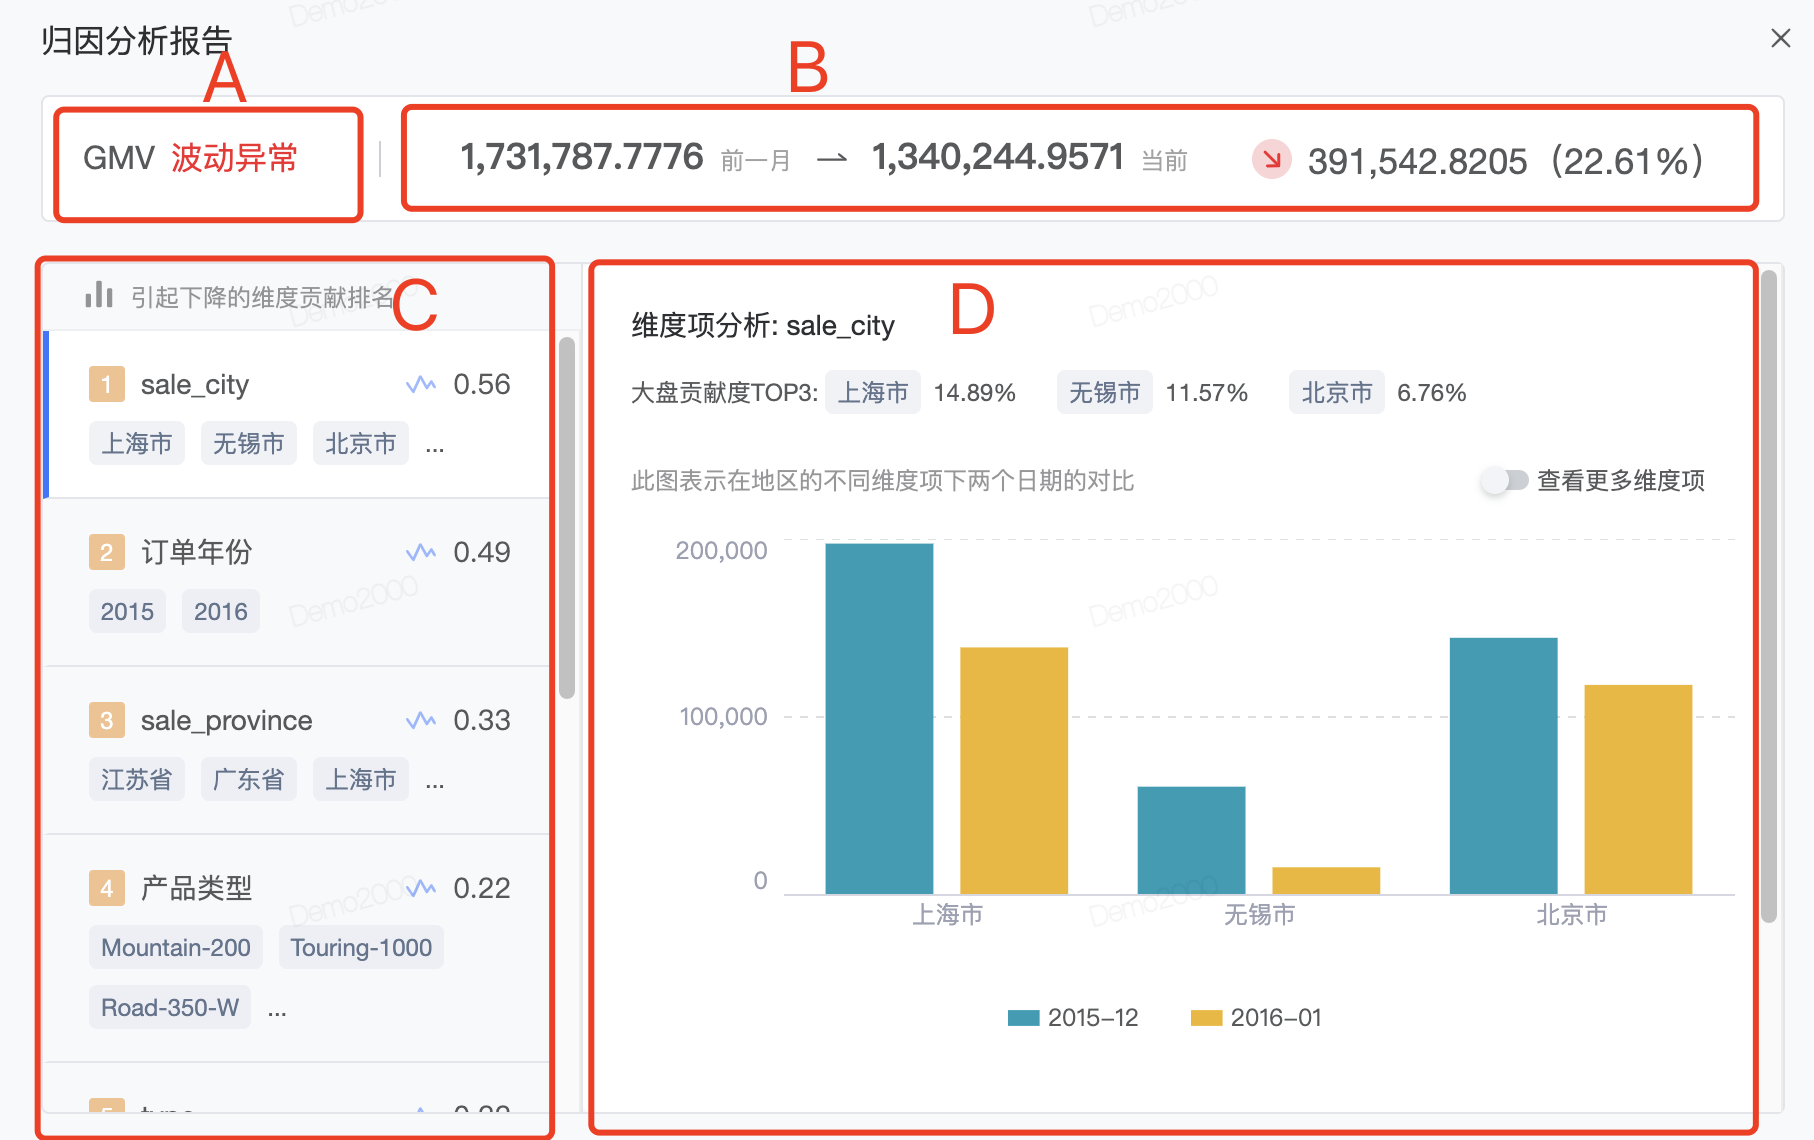
A: Fluctuation status. Based on recent data, determine whether the indicator's fluctuation is normal
B: Indicator change. The change of the indicator compared to a certain period ago
C: Dimension contribution ranking, single dimension:
- Dimension name
- Gini coefficient, used to indicate the degree of impact on indicator changes
- Top 3 dimension items by overall contribution
- When used together with CDP, the ability to create new groups is also available here
D: Analysis of specific dimension items
Attribution analysis configuration
Supports dataset-level attribution analysis configuration. When attribution analysis is performed on this dataset, it will be based on the configured attribution basis and display dimensions, and the set number of results will be displayed.
Entry
Entry 1 Visual query: Click the ⋮ in the upper right corner of the dataset information on the left, and select "Attribution analysis configuration"
Entry 2: Dataset: Open the dataset to be queried, and select "Attribution analysis configuration" in the upper right corner
Global configuration and personalized configuration
In attribution analysis configuration, you can preset the attribution basis, display dimensions, and number of results to display.
A dataset often contains multiple metrics. When different metrics require different attribution configuration settings, click "Custom configuration" to select metrics for special configuration. Global configuration applies to metrics other than those with "Custom configuration".
If no custom configuration is set, the global configuration applies to all metrics.
Criteria for anomaly detection
- Time series prediction: Automatically determined based on system prediction. The criterion is whether the result falls within the default prediction range of the time series prediction.
- Fluctuation greater than: Determined based on period-over-period or year-over-year fluctuation. If the fluctuation exceeds the specified value, it is considered an anomaly.
Dimension restriction for attribution
After enabling dimension restriction for attribution, not all dimensions will be included in attribution analysis, which helps avoid analyzing meaningless dimensions, prevents misunderstandings, and reduces computational load.
- Only dimensions with fewer than 1,000 dimension items participate in attribution: The threshold can be set freely. If the dataset contains dimensions such as id or device number with a large number of dimension items and no attribution significance, select this option.
- Exclude certain dimensions: Manually exclude specific dimensions so they are not included in attribution.
Result display restriction
By default, the attribution analysis report displays the analysis results for all dimensions in descending order of their impact on the Gini coefficient. After selecting this option, you can limit the number of displayed dimensions. After selecting this option, some impactful dimensions may not be fully displayed.
Supported expressions
Expressions supported by attribution analysis
Expression
Example
count(distinct XXX)
count(distinct user_id)
sum(XXX)
sum(col), sum(col/100), sum(1/col), sum(case when result = 'failed' then 1/result_count else 0 end)
avg(XXX)
avg(col)
sum(XXX)/sum(XXX)
sum(col1) / sum(col2), sum(case when result='failed' then 1 / result_count else 0 end) / sum(1 / result_count)
sum(XXX)/count(XXX)
sum(vv)/count(uid)
count(XXX)
count(col1)
sum(XXX)/100
sum(col)/100,
100/sum(XXX)
100/sum(col)
XXX/XXX
col/1, col1/col2
XXX
col
Expressions not supported by attribution analysis
Expression
Example
count(distinct XXX) / count(distinct XXX)
count(distinct pid) / count(distinct uid)
uniq(XXX) / uniq(XXX)
sum(XXX) / count(distinct XXX)
sum(vv) / count(distinct uid)
sum(XXX) / sum(XXX) / sum(XXX)
sum(XXX) / sum(XXX) / 1
XXX - YYY
profit - cost
Support will be added in the future
Expression
Example
uniq(XXX)
uniq(XXX)
uniq(XXX)/100
uniq(XXX)/100
Scope of attribution dimensions
The following types of dimensions will not appear in the dimension list on the left side of the attribution analysis report list:
- A dimension whose expression is id or date;
- A dimension whose top 1 dimension item's contribution value is too small will not be displayed: For example, if there is a dimension "Province" and the dimension item "Shanghai" has the highest contribution value, but the contribution percentage is less than 1%, it will not be displayed;
- A dimension with only one dimension item will not be displayed;
- The partition field dimension will not be displayed.
- If there are no dimension items under a dimension, the dimension will not be displayed.
- In time period analysis, if the number of dimension items for a dimension is too large (>10K), it will not be displayed.
- When there are too many dimensions (more than 15), only some dimensions will be included in the calculation—those with a high Gini coefficient and those most frequently used by the current user.
