Intelligent Data Insight
Intelligent Data Insight


- Documentation
 Intelligent Data InsightDataWind User GuideVisualized Query and AnalysisChart IntroductionPivot Table
 Copy page
 Download PDFCopy pageDownload PDF
Pivot tables summarize and present data according to column and row dimensions. A pivot table can be displayed by simply configuring column dimensions, row dimensions, and metrics. Compared with tables, pivot tables will be Dimensions and metrics divided into rows and columns, which is more conducive to table presentation in multi-dimensional situations.
2.1 Common usage scenarios
Pivot tables are usually used in scenarios where data calculations need to be performed in different combinations when classifying and summarizing detailed tables. For example, in different regions, which categories of products are sold and in what quantities.
2.2 Example of use process
Step 1: select Chart Panel - Pivot Table
Select PivotTable, and the data panel will transform to have column dimensions, row dimensions, and metrics.
Step 2: set the column dimension, row dimension, and metrics.
Dimensions and metrics Dimension Filter
Select 'Region'as the column dimension, 'Category'as the row dimension, and 'Quantity' as the metric; For how to set filter condition, see Frequently Asked Questions.
Step 3: modify the chart style as needed
3.1 Pivot table icon
3.2 Configuration rules
Dimensions: Supports 0 or more dimensions.
Metrics: Supports 0 or more metrics. When there are more than two metrics, the metric name will be generated.
Metric name: is a placeholder capsule, the metric name can be freely dragged in the column dimension and row dimension. When there are 2 metrics in the data panel, a metric name will be generated. When there is only one metric, the metric name will automatically disappear.
tip
When the pivot table has both row and column dimensions, you can set the display of corner headers in the table style of the chart configuration. By default, only row dimension field names are displayed; if you want to display both row dimension and column dimension field names, you can set the table corner header to "Show all field names". This configuration is also suitable for tiling, tree display, and downloading Excel results.
Example: 1 column dimension, 1 row dimension, 2 metrics
- Metric name in column dimension
- Metric name in-line dimension
3.3 Chart configuration
3.3.1 Basic format
Support setting data display mode, such as tiled display and tree display;
- When the selected data display method is tree-shaped, it is necessary to choose the number taking method as full number taking/incremental number taking. The following is the description of the number taking method:
Counting method
Description of the number method
Take all
The pivot table will be fully counted each time it is loaded, with an upper limit of 10000 (it can be adjusted to 50,000 after opening pagination).
Increment
The pivot table loads the data of the first node by default, and incrementally fetches the data of the new node each time you click to expand the new node. The upper limit of a single fetch is 10,000; at the same time, the upper limit of the overall data display of the pivot table is 10,000, and the first 10,000 items will be displayed in sequence after exceeding it;
Other restrictions:- The function in the analysis only supports the top N pieces of aggregate, TopN-result data.
- Fixed download of full amount of data when downloading.
- Incremental loading does not work on the mobile end.
When configuring both row and column dimensions, support for displaying row and column dimension field names. Specifically, it can be configured in the table style > table corner header:
- Priority display row dimension field name: Default option, maintain this configuration after the pivot table upgrade; when the row dimension exists at the same time, the row dimension field name is displayed first.
- Show all field names: Show both row and column dimension field names when the row and column dimensions exist simultaneously. After switching, the pivot table is drawn according to the new header structure.
Set whether the data can be automatically wrapped.
Support setting the basic format to compact mode, and support adjusting the arrangement of compact mode.
3.3.2 Pagination
- When there are many data entries, the pagination can be configured. Pagination supports a minimum of 10 pages per page, and a maximum of 100 pages per page.
- V2.91.0 and above, the upper limit of data display can be selected from 1k, 2k, 5k, 1w, 2w, 3w, 4w, 5w data, or manually enter positive integers(the upper limit is 5w) data.
3.3.3 Text alignment
Automatic, left, center, and right alignment can be set for dimensions(rows/columns) and metrics, respectively. Here, the overall alignment can be adjusted according to individual needs.
After opening the advanced configuration of the pivot table, you can set the text alignment mode for the following areas, all of which support left, center, and right:
- Column dimension enumeration value: Default left, controls the alignment of column dimension members in the table.
- Row dimension enumeration value: Default left, controls the alignment of row dimension members in the table.
- Metric Name: Centered by default, controls the alignment of metric header names.
- Metric value: The default is right, which controls the alignment of the metric data in the table.
- Corner header area: The default is centered, and only unified configuration alignment is supported.
tip
The corner header area does not support separate configuration, and the alignment of multiple dimension field names within the area cannot be set separately. Advanced configuration is turned off by default, and after closing, it will still take effect according to the alignment configuration of the original columns, rows and metrics.
3.3.4 Table style
You can configure the color of the column header and the numerical area, and you can configure the field name display method of the table corner header.
- Prioritize row dimension field name: Default option, keep this configuration after pivot table upgrade. When both the row dimension and the column dimension exist, the corner head preferentially displays the field name of the row dimension.
- Show all field names: Show both row and column dimension field names when both row and column dimensions exist. After switching, the pivot table is drawn according to the new header structure.
- This configuration works for both tiled display and tree display; only tiled display is supported for metric groups.
- When Show all field names is turned on, the column dimension field name display effect in the page is preserved when downloading Excel.
- The original pivot table pagination and sorting capabilities remain available; the newly added column dimension field names and metric name headers do not support sorting.
3.3.5 Special value
You can customize the special values of dimensions/metrics, and you can set the special values to be displayed as blank/NULL/0/--.
"Pivot Table" supports checking "Hide rows as 0 or null" when using "Difference" or "Difference Percentage" in the "Table Calculation" function.
3.3.6 Display mode
The display mode defaults to setting the column width and row spacing according to the content of the data item, and the column width and row spacing can be adjusted.
- Column Width: Standard, Adaptive, Custom Column Width (in pixels)
- Line spacing: Comfort mode, Efficient mode, Custom spacing (in pixels)
- Frozen area width: When there is a frozen area in the table, it supports setting the frozen area width in pixels. Default(the sum of the column widths in the frozen range has been selected), Customization: After selection, the text box is provided to support px-level configuration, and the maximum input value is limited to the sum of the column widths of the frozen area.
3.3.7 In-diagram control styles
The in-image controls include in-image filters, dynamic dimensions/metrics, and in-image parameters. After being displayed in the image, you can adjust the title and filter content placement, as well as typesetting settings.
3.3.8 Restore default settings
Click Restore Default Settings, and the content in the above chart configuration will be restored to default.
3.4 Field Settings
3.4.1 Data supports multidimensional 0 metrics
Since V2.50.0, pivot tables can support multiple dimensions, but without any metrics
3.4.2 Parse text
See Overview of Field Configuration.
3.4.3 Conditional format
3.4.4 Metric conditional format
See Overview of Field Configuration.
3.4.5 Row drill settings
Click on the inverted triangle icon on the left side of the column metric capsule and select "Drill Settings" in the pop-up drop-down list to manually configure the drilling path of the dimension, so that there is no Configure Field Hierarchies linkage between fields on the data.
3.5 Column operations
3.5.1 Adjust column width
Drag the dividing line between the two columns of the table with the mouse to adjust the column width of the pivot table.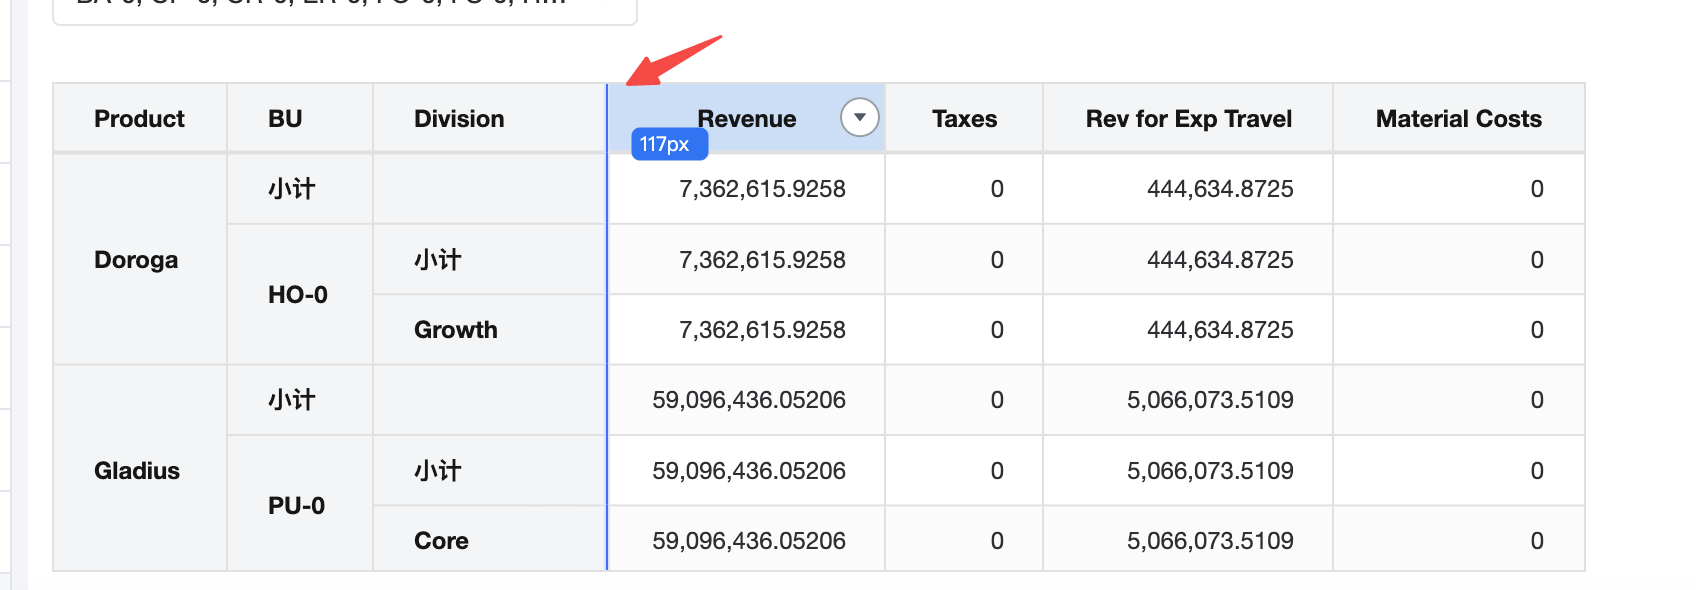
3.5.2 Column sorting
Hover the mouse in front of the column name in the header, and the column sorting by and sorting button will be displayed. Click the button to sort the column content, and click again to cancel the sorting. Note: If "Top N" is used in the analysis, it will be sorted based on the selected Top N data.
tip
When the table corner header is set to show all field names, the newly displayed column dimension field names and metric name table headers do not support sorting; data area sorting is still performed according to the original sorting rules of the pivot table.
Simultaneous pivot table total fields support sorting
