Volcengine Kubernetes Engine
Volcengine Kubernetes Engine
Volcengine Kubernetes Engine


Document
Volcengine Kubernetes Engine
What's New
History feature release notes
Kubernetes version release notes
Containerd runtime release notes
Add-on release notes
Monitoring add-ons
Scheduling add-ons
DNS add-ons
Security add-ons
GPU add-ons
Sandbox add-on
Security announcements
Product Announcement
Historical announcements
Overview
Getting started
User guide
Clusters
Creating clusters
Connecting to clusters
Upgrading clusters
Node pool
Creating node pools
Scaling out/in node pools
Nodes
Authorization management
Image
Namespaces
Networking
Cluster network
Container Network
Service
LoadBalancer
CLB
Ingress
APIG Ingress
ALB Ingress
Customize ALB Ingress forwarding rules
Certificate and security
CLB Ingress
Nginx Ingress
Gateway API
Workloads
Creating workloads
Configure workloads
Pods
Configuration management
Image acceleration
Storage
FSX client
EBS Volumes
TOS Volumes
NAS volumes
FSX access methods
NFS access methods
EFS volumes
vePFS volumes
FSX access methods
vePFS Client access methods
NFS access methods
CloudFS volumes
Local volumes
Autoscale
Node autoscaler
Workload autoscaler
Horizontal Pod Autoscaler (HPA)
Cron Horizontal Pod Autoscaler (CronHPA)
Intelligent Horizontal Pod Autoscaler (IHPA)
Horizontal Pod Autoscaler based on event-driven (KEDA)
Add-on management
Network add-ons
Storage add-ons
Monitoring add-ons
Scheduling add-ons
DNS add-ons
GPU add-ons
Core add-ons
Sandbox add-on
Upgrading add-ons
Heterogeneous computing
NVIDIA GPU
mGPU scheduling
RDMA high-performance computing
Scheduling management
Topology-aware scheduling
QoS-aware scheduling
Observability
Log management
Basic observation
Setup & Configuration
Cluster observation
Storage observation
Other observation
Using metrics
Full stack observation
Alert management
Diagnosis and inspection
Node check and self-healing
Application center
Backup center
Stability
Large-scale cluster management
Best practices
Authorization
Clusters
Nodes and node pools
Networking
Storage
Scheduling
Observability
Solution
Security and compliance
API reference
Cluster management
NodePool management
Node management
Virtual nodes management
Add-on management
Tag management
Access policy management
Instance images management
Cloud native observability
Inspection and diagnosis
Task management
Volcengine Container Instance
Appendix
SDK reference
Development guide
Terraform
FAQs
General FAQs
Cluster FAQ
cluster management
cluster network
cluster upgrade
Node and Node pool FAQs
Authorization FAQs
Workload FAQs
Service and Ingress FAQs
Storage FAQs
Heterogeneous computing FAQs
Observability FAQs
Quota FAQs
Add-on FAQs
Cloud-native AI
ServingKit
LLM applications
ComfyUI application
Deploying the Al inference application through Helm
Deepseek practices
Qwen practices
Kimi practice
Seed practices
Best practices
DeepSeek model deployment
GLM model deployment
MiniMax model deployment
Qwen model deployment
Kimi model deployment
Volcengine Container Instance
What's new
Historical feature release notes
Product Announcement
Overview
Billing
User guide
Integrating with VCI
Virtual node
VKE cluster uses virtual nodes
Self-managed/third-party cluster uses virtual node
Creating an instance
General purpose instance
GPU-accelerated computing instance
VCI Agent Sandbox
Startup acceleration
E2B-based management
Upgrade guide
Networking
Monitoring
Scheduling
Container configuration
VCI Image Cache
Best practices
Security and compliance
FAQs
- Documentation
 Volcengine Kubernetes EngineVolcengine Kubernetes EngineUser guideObservabilityObservability overview
 Copy page
 Download PDF
Observability
Observability overview
Copy pageDownload PDFObservability overview
distributed With the widespread use of Kubernetes, cloud-native architecture poses new challenges to observability. In the context of microservices and containerization, you need to fully understand the running status of applications and Kubernetes infrastructure, quickly locate and resolve issues, and collect and analyze data on the running status of applications and clusters for continuous improvement. This ensures a secure and reliable operating environment.
This topic introduces the composition of the Volcengine Kubernetes Engine (VKE) observability system, as well as best practices for building a VKE observability system by using the cloud services of Volcano Engine.
Observability challenges posed by Kubernetes
The Kubernetes system poses the following challenges to observability:
- Complex architecture: The Kubernetes system consists of the control plane and data plane, and contains various add-ons that communicate with each other. Observability must provide comprehensive coverage.
- Dynamic resources: In the Kubernetes cluster, resources such as pods and services are dynamically created and assigned IP addresses. When you recreate pods, new resources and IP addresses are allocated to the pods. You need to perform dynamic monitoring on the creation and deletion of these resources, as well as the utilization of underlying resources.
- Microservices architecture: In the context of microservices and containerization, traditional applications are separated into multiple add-ons based on the microservices architecture, and the replicas of each add-on can be autoscaled based on your business requirements. Therefore, the requirements for troubleshooting are high.
In response to the observability challenges posed by the Kubernetes system, especially when cluster size quickly increases, the efficient and reliable observability capabilities of the Kubernetes system ensure system stability.
Observability architecture
In cloud-native architecture, observability consists of three pillars, including logging, distributed tracing, and metrics.
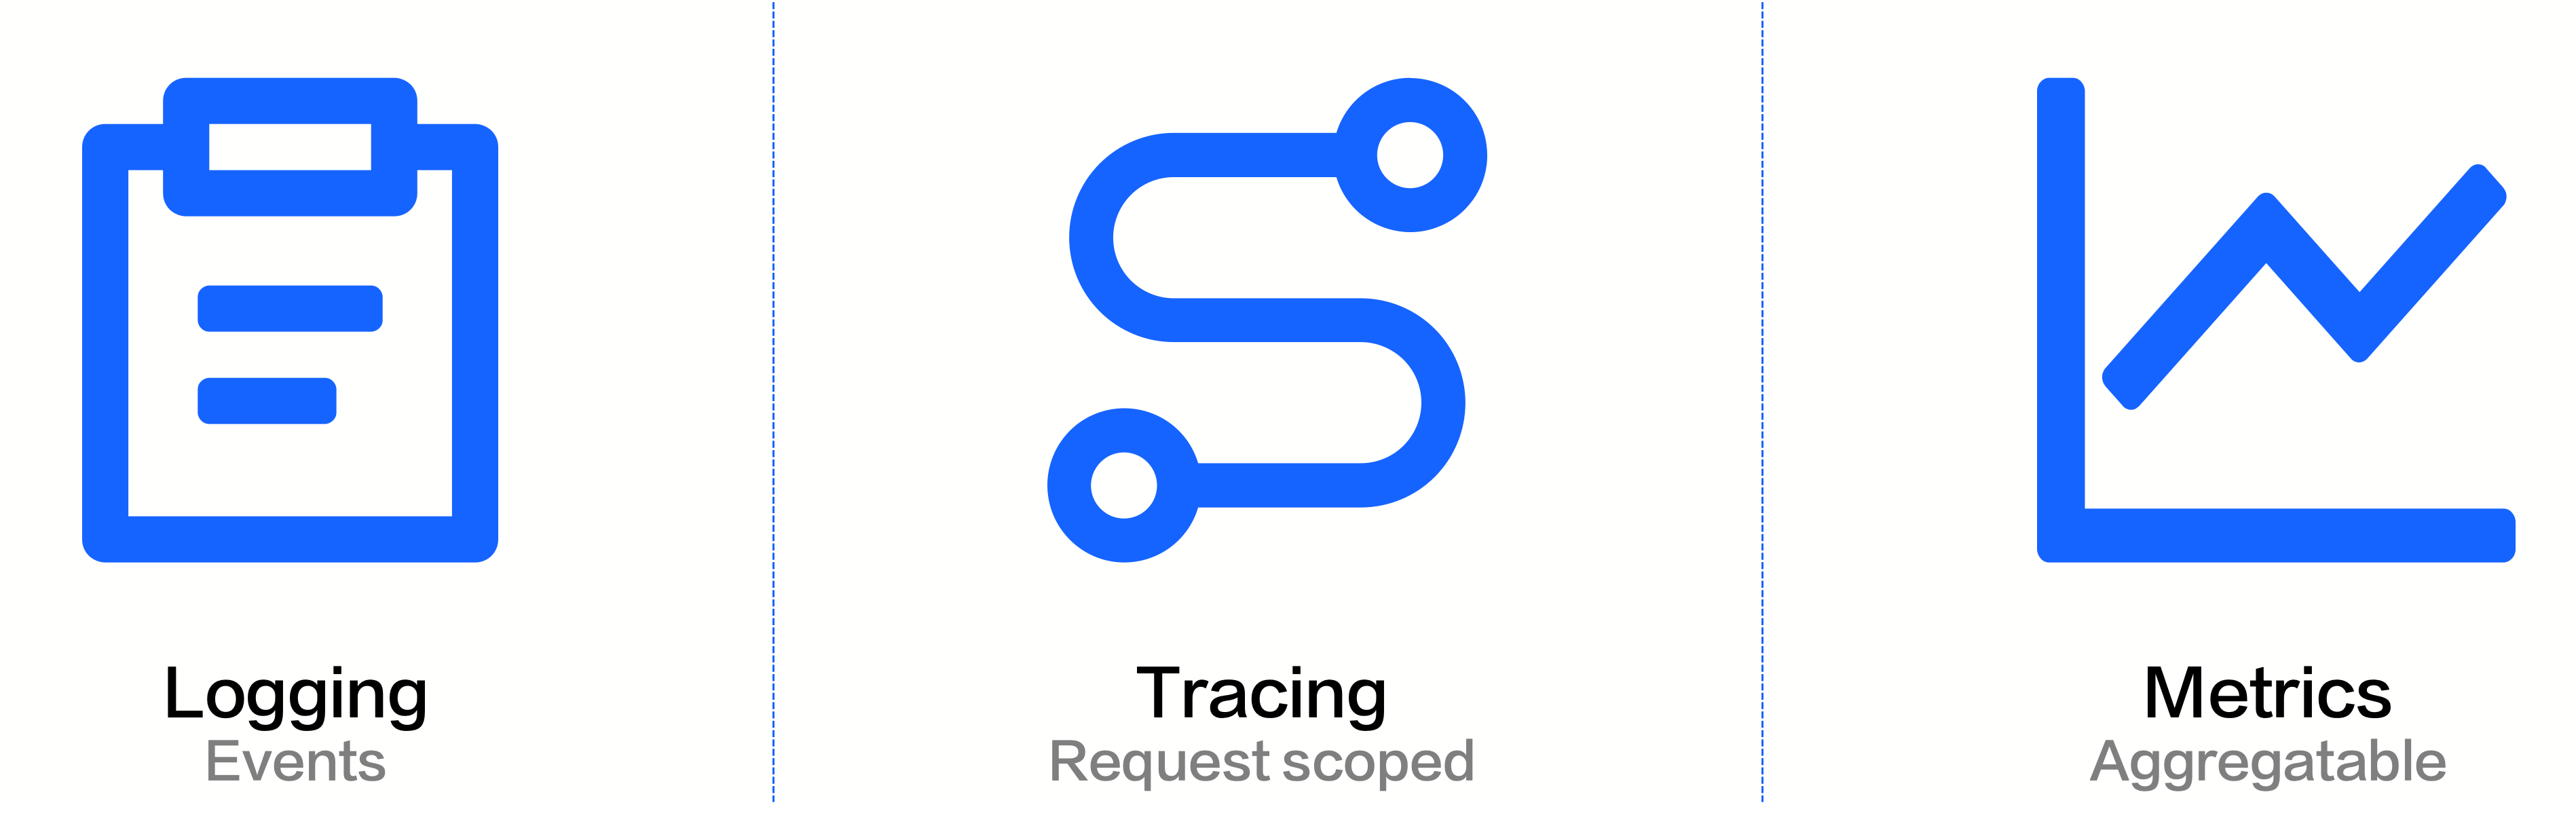
- Logging: Logs and events record discrete system behaviors and states, which can be used to analyze program behavior. When a program encounters an error, you can identify the error cause and resolve the error by using logs and events. Outputting logs is easy for an application, but collecting and analyzing logs can be complex. In scenarios with tens of thousands of cluster nodes, rapidly scrolling event information, and terabytes of text, transmission and aggregation are not simple tasks. Therefore, specialized systems need to be integrated to collect, store, view, and retrieve logs.
- Tracing: In cloud-native systems where applications are deployed and managed as microservices, tracing is not limited to the call stack. An external request often requires the coordinated response of multiple internal services. In this case, the complete trace spans multiple services within the cluster. It includes both the network transmission information between services and the call stack information within each service. Therefore, tracing in cloud-native systems is also referred to as end-to-end tracing. Tracing is mainly used for troubleshooting. For example, it helps you identify which part of the trace or which method encounters an error or is blocked, and identify whether the input and output meet expectations.
- Metrics: Metrics refer to the aggregation of statistics on a specific type of information in the system. For example, the usage, utilization, and quota of cluster nodes. Metrics are mainly used for monitoring and alerting. When certain metrics reach risk thresholds, alerts are triggered to enable automatic processing or to notify the administrator to intervene.
Logging
Project | Description |
Project | Description |
Log type | Multiple types of logs for clusters and applications are supported, including:
|
Log storage | Large volumes of data can be persistently stored, with stable performance and ease of reading and writing. |
Retrieval and analysis | Keywords can be used to search for logs and quickly locate abnormal events. SQL can also be used for real-time statistics and analysis of logs to quickly obtain key data. |
Visualization | Query and analysis results can be visualized. Multi-dimensional statistical chart types and custom interactive dashboards are supported to facilitate real-time data monitoring and operations. |
tip
TLS supports query and analysis in seconds for large volumes of data, provides efficient and real-time log processing tools, facilitates the use of log data, and effectively improves operation and maintenance capabilities as well as data analysis efficiency. After a cluster fails, you can view historical log information in TLS for troubleshooting.
Events
Kubernetes events are objects that indicate what happens within clusters, nodes, pods, or containers. These objects are typically generated in response to changes within the Kubernetes system. Kubernetes events help you understand the health status and performance of clusters. Events are generally classified into two types:
- Warning event: Indicates that this event transitions between unexpected states.
- Normal event: Indicates that the expected state is consistent with the current state.
Metrics
VKE achieves the collection, monitoring, and alerting of metrics for clusters, basic resources, and applications by using solutions of Volcano Engine, such as cloud native observability (basic observability and full-stack observability), application performance observability, and AI observability.
Solution introduction | Solution introduction | Related documentation |
Solution introduction | Solution introduction | Related documentation |
Basic observability | Cloud native basic observability is achieved through VMP of Volcano Engine. It uses high-availability collectors deployed in clusters to monitor cluster resources, control plane services, networks, and workloads. Service discovery methods, such as ServiceMonitor and PodMonitor, can be used to achieve discovery and monitoring of custom services within clusters. | |
Full-stack observability | Cloud-native full-stack observability, built on eBPF, achieves high-performance, non-intrusive, full-stack data collection. It fully supports in-depth observability at the kernel level and automatically parses application protocols such as HTTP(S), DNS, and gRPC Unary/Streaming when used with the high-performance application protocol parsing module. It integrates Kubernetes metadata to provide a non-intrusive full-stack observability capability at the resource, network, and application layers. | |
Application performance observability | Application performance observability, built on the APMPlus service of Volcano Engine, supports end-to-end monitoring capabilities for basic resource performance, service and code layers, and the health status of online application operations. It can be integrated with Java, Go, Python, and other applications, such as large models, LLMs, and agents, through methods such as a self-developed agent and OpenTelemetry for end-to-end monitoring, which provides richer capabilities for restoring abnormal scenarios. Core features include service monitoring, trace analysis, error analysis, log monitoring, custom monitoring, alerting tasks, and other features. | |
AI observability | When you deploy large language models (LLMs) in a VKE cluster, you can analyze the AI profiling results of specified containers. This facilitates detection and optimization throughout the LLM life cycle, including training, inference, and optimization. |
Last updated: 2026.07.24 10:53:28
All rights reserved © Beijing Volcano Engine Technology Co., Ltd2024
